Saturday, April 13, 2013

Die Another Day

Saturday, April 13, 2013
5:04 P.M.

From Wednesday, April 10, 2013:

"We'll have some rain coming in Friday afternoon, but I'll bet my life on having a strong convergence zone somewhere in the area Saturday afternoon due to a cool, moist, onshore flow splitting around the Olympics and converging somewhere along Puget Sound. If I'm still alive on Sunday, you'll know I was right."

Well, it looks like I will be alive on Sunday, and more alive than I've ever been.

Alright, well know that ya'll know I'm like... the best forecaster ever... let's actually talk about what is happening outside right now.

Camano Island Radar: 04:58 pm PDT Sat 13 Apr 2013
This is the radar picture taken from the Camano Island radar at 4:58 pm today, and you can see that there are a lot of showers around Puget Sound. Interestingly enough, there actually look to be two convergence zones, one over the San Juans and another, stronger one directly over the Seattle area. Because there are so many other showers in the area, it is a little tough to make out zone over Seattle, but as evidenced by the band of precipitation and the extremely heavy showers embedded within this band, it is there.

The scale on the right uses different colors to denote different rainfall rates. More specifically, it measures dBZ (decibels relative to Z), and is the meteorological measure of Z (reflectivity) of a radar signal reflected off an object. This is a logarithmic scale, so small increases in the scale represent much larger increases in reflectivity (and therefore precipitation in most cases). Whenever you see reds on this radar, you can be assured that there is heavy rain or hail in the area, and if you look closely at this picture, you can see that the reds are centered right over Seattle.

UW Campus looking out over Red Square: ~ 5 pm
I've counted about 4-5 lightning strikes at the UW in the last 15-20 minutes or so, which is quite a few for a springtime northwest thunderstorm. There was some hail mixed in with the rain at one point, which indicates strong updrafts and instability within the shower, as hailstones cannot form without updrafts suspending them to a point where they can accumulate ice before they finally become too heavy and fall to the ground. Right now (5:23), the rain has almost completely stopped, so let's take another look at the radar.

Camano Island Radar: 05:18 pm PDT Sat 13 Apr 2013
As you can see, the rain has moved south of the UW area and is now directly over downtown Seattle. The actual shape of the convergence zone is better defined in this picture.

1km resolution GOES-West: Pacific Northwest Visible Satellite 05:00 pm PDT Sat 13 Apr 2013
You can even see the convergence zone over Seattle on the satellite. See that little finger extending westward from the Central Cascades over to Hood Canal? That's the convergence zone. Another thing to note is the incredible rain shadow over Eastern Washington. Look at how the clouds just completely die out once you move to the east of the Cascade crest and there is downslope flow. Simply beautiful stuff.
With the cold air aloft, there are very low snow levels. The passes are getting hammered, and I even heard of a few snowflakes flying by Western Washington University this morning.

The convergence zone should gradually dampen as we head towards midnight, but I'd still be on the lookout for a couple more strikes here and there. Springtime Pacific Northwest weather... it can be exciting!

Stay safe.
Charlie

Friday, April 12, 2013

Working Together to Forecast Weather Better

Friday, April 12, 2013
2:57 PM

If any of you ever watched a certain t.v. show that's about more than just card games, you are familiar with the picture above.
We need to work together more as a society in general. I mean, look at Congress. The rifts between the Democratic and Republican Parties are huge, and progress is being stifled by people who are unwilling to make compromises. I disagree strongly with a lot of the actions that are being perpetrated both domestically and abroad by our government, and I know that a lot of my priorities don't match up with those being debated in our nation's capital. However, even if I disagree, it is still better to try and work out a solution that works for the majority of people rather than just debate, pass, filibuster, veto, etc. One of the sectors that is in the most dire need of cooperation, though, is the meteorological sector.

There is plenty of international cooperation when it comes to climate change. There is a conference called the IPCC (International Panel on Climate Change) that has produced four major scientific reports drawing upon scientists all over the world with the first one occurring in 1990 and the last one occurring in 2007, with the next one expected to be completed in 2014. The Kyoto Protocol (1997) to the United Nations Framework Convention on Climate Change (UNFCCC) is an international treaty that restricts the amount of greenhouse gases that an industrialized country can release. Greenpeace, a non-governmental environmental organization that has offices in over 40 countries, focuses on essentially everything necessary to keeping our earth green and peaceful, and climate change is one of their chief priorities. There are countless other organizations that work together to research paleoclimate, assess our current climate and GHG emissions, and predict future scenarios based on the magnitude of GHGs emitted into the atmosphere, with particular emphasis on predicting both the direct warming from the greenhouse effect due to these gasses and the additional warming that will be experienced due to positive feedbacks, as there are far more positive feedbacks than negative feedbacks at this time. One of the strongest positive feedbacks right now is the relationship between declining sea ice in the arctic and an increased absorption of solar insolation due to the much lower albedo of water. Just to clarify, albedo represents the amount of solar radiation radiated back into space. Snow has a high albedo, so it reflects a bunch of solar radiation to space. Water has a low albedo and absorbs most of this radiation, thus warming the planet at a higher rate.

Unfortunately, the meteorological sector of atmospheric sciences is dominated the competition and not cooperation. While some competition is good (basketball games would be really boring if the teams both tried to help each other win), competition results in inconsistencies in data collection and forecasting. This was brought into the forefront of American media when Superstorm Sandy hit the United States, as the European model consistently forecast a U.S. landfall while the American model took the storm harmlessly out to sea. Around a month ago, the two main American models, the NAM and the GFS, predicted a monster snowstorm to hit D.C.. The storm never came. To be fair, this was an extremely difficult forecast and made forecasting Sandy look like a piece of cake, and even the European model wasn't perfect. However, it produced far less of a snowstorm than the American models. The bottom line is that there are countless examples of the European model clearly outperforming the U.S. models, and there are very few examples of the U.S. models triumphing over the European model.

Now, at first glance, it may seem like I'm trying to advocate for the U.S. to simply try to hitch a ride with the European model to improve their weather forecasting. Well, it'd be nice if we could run UW's super high resolution mm5/WRF models using output from the European model, but I believe we could even improve upon the European model if we lumped our resources together. The European model has ten times the computing power of the GFS, yet we have some extremely powerful computers that we would be using that are currently being used for other services, particularly climate prediction. If we could work together with the Europeans to "spread the responsibilities" of meteorological and climatological prediction, we would certainly end up with better forecasts for the short term. Much of climate research is applicable worldwide (after all, when was the last time there was an international conference on Puget Sound Convergence Zones?), but meteorological research pertains to certain areas. We share our expertise on climate with the world, but we have limited access to the extensive numerical prediction programs that are occurring in Europe. If we could further propagate our research throughout the world and create agencies that work across countries (ex: not NOAA or NASA but something that all countries are involved in), I feel like we would have better success. I'm sure there are some agencies like this, but I cannot name any off the top of my head. Regardless, I still think they are a good idea.

Additionally, there is research that has been done by the U.S., particularly for mesoscale modeling, that has not been done on the same scale in Europe. A prime example is our high-resolution models that have a resolution of 4/3 km. This is extremely useful in predicting certain types of weather in certain regions, but it is useless if the models they are initialized off of (like the GFS and NAM) are poor forecasters in the first place. If we could share our knowledge, research, and resources dedicated to mesoscale meteorology with the European's clear advantage in synoptic scale meteorology, amazing things could be accomplished.

But wait, there's more! In the U.S., we have a very cool program associated with the National Weather Service (NWS) called "CoCoRaHS" (Community Collaborate Rain, Hail, & Snow Network) where volunteers send in daily precipitation reports. On average, 18,000 - 20,000 precipitation reports from average citizens all across the U.S. and Manitoba are reported each day. That's a lot of precipitation reports. Because of the higher computer power that the European model has, they can take in more data and therefore obtain better forecasts by being more specific with their numerical inputs and avoiding the need to "approximate" what the weather would be in certain locations between the data points. I do not know if the ECMWF (European Center for Medium-Range Weather Forecasts) has a system like this, and I also do not know if any of the models use any of this data. Still, it just goes to show that there is plenty of data available, and by combining resources with those Europeans, we could achieve even better weather forecasting.

I am technically a CoCoRaHS member but I have had problems with my weather station and haven't sent in reports. It's something I definitely want to do in the future; it's a great way to help education and research applications. You definitely learn a lot about simple ways to accurately measure precipitation and report it to the NWS. Anybody can become a CoCoRaHS member, but you are required to attend a training session (either in-person or online) to be certified and have your reports actually be recognized by the NWS. It's something I'd highly recommend; you can apply here.

I should point out that I believe it is important to have different weather models, however, as the equations that each weather model uses to create forecasts from numerical data are slightly different. Often, the weather that ends up occurring is a "blend" of what was forecast by individual models, so it is definitely important to have different models. Another thing that is becoming more and more common in weather forecasting is the use of "ensembles" of output from models, with each ensemble using a slightly different set of initial conditions. This statistical and probabilistic approach to weather forecasting has been proven to have greater accuracy than the "operational" approach, which just uses all the data from one set of initial conditions (at least to my knowledge, somebody please correct me if I'm wrong). The UW runs their own probability forecasting tool for the Pacific Northwest, and the few times I have used it, it has done an exceptional job, particularly with short-range temperature forecasts. You can learn more about it here.

I know I've written a lot... I'm not the best writer by any means and I'm definitely not as knowledgeable about this subject as I would like to be, but to sum things up, the Americans and Europeans could share the resources they have between them and obtain better forecasts as a result. And as we saw with Hurricane Sandy, the benefits of doing so would be crucial to the health of our economy and the safety of individuals.

On another note, the competition between private sectors can also have negative consequences for the accuracy of forecasts. Most people do not get their weather information from the NWS; they get it from guys like Al Roker, Steve Pool, Jim Cantore, and large commercial organizations like The Weather Channel or Accuweather. Now, my understanding of the economy is extremely poor, as evidenced by this meme I just made.


However, I do know that some weather sites have resources that others do not, and that weather forecasts would be better communicated to the public if these private companies helped each other out and built upon the resources that each of them have.

Perhaps somebody could take these ideas that I have laid forth on this blog and think of some way to practically apply them. But the benefits of increasing weather forecasting accuracy would be huge, and I believe that international, domestic, and commercial cooperation is a very efficient way to do this.

Charlie

Thursday, April 11, 2013

Small Zone, Intense Convergence

Wednesday, April 10, 2013
10:30 P.M.

I don't own an umbrella. I don't own rain boots.The only thing that I need to protect me from the elements is my skin. It's worked out pretty well so far.

But today, when I walked out of a physics lab, I saw looked out the window and saw a torrential rain shower that ranks up with the heaviest I've ever seen in Seattle. I wanted to head over to a different physics building that was a measly 50 feet away, but I had to sprint across the pavement to keep from getting absolutely drenched in water. I suddenly wished I was enclosed in some sort of waterproof force-field, like the ones Violet made from The Incredibles.

Source: DisneyScreenCaps
However, the rain was still nowhere near as heavy as the rain I witnessed at my house between 4 and 5 P.M. on December 14, 2006, which was the day of the Hanukkah Eve Storm. I don't think I've dedicated a specific blog to urban flooding, but I will do so in the future. Kate Fleming, an award-winning audio book producer and narrator who lived in Madison Valley, died when she drowned in her basement due to rising floodwaters from the downpour, and a more effective water drainage system was built soon afterward to prevent a tragedy like this from ever happening again. Below is a Youtube video of that storm... I will never, ever forget the roar of the rain outside my house. Rest in peace.


Whereas the 2006 Seattle flooding event was associated with the most damaging windstorm to hit the Seattle area since 1962, this brief downpour was associated with a weather phenomenon Seattle natives should be quite familiar with - the Puget Sound Convergence Zone.

Retrieved from Colorado State University's Virtual Institute for Satellite Integration Training (VISIT) "Meteorological Interpretation Blog"
The idea behind the convergence zone is pretty simple... winds coming off the ocean (typically from the northwest in the wake of a cold front) are directed to the north and south of the Olympics through the Strait of Juan de Fuca and the Chehalis Gap, respectively. These air masses curve into the Western Washington lowlands, converge, and cause clouds and precipitation. The result is a band of precipitation that generally stretches across the lowlands into the mountains and is located around the King/Snohomish county line. However, I have seen convergence zones form in Skagit and Pierce counties as well.

Let's take a look at a radar image that shows the convergence zone we saw this afternoon.


This is a pretty typical convergence zone for the area. It is roughly perpendicular to Puget Sound and extends into the Cascades. It is a little further south than normal and doesn't extend as far westward as some other convergence zones I've seen, but it's still a pretty good example nonetheless. If you take a look really closely, you can see a tiny but intense shower embedded within the convergence zone over the UW campus. Meanwhile, places a mile to the north or south were completely dry. The Pacific Northwest may not get big supercell thunderstorms or hurricanes, but we do have some local weather features that keep things interesting around here, and the convergence zone is one of those.

If I had to estimate, I'd say rainfall rates were around or slightly over an inch per hour for the 10-second duration it took me to run from one building to another. I checked the UW atmospheric sciences building rooftop data and it said that there were 0.05 inches of rain from 2-3 PM and 0.07 inches from 3-4 PM. This just goes to show that when it comes to heavy rain, I was in the wrong place at the wrong time. Had I waited a couple more minutes to flee from one building to another, I wouldn't have to wait an hour for my sweatshirt to completely dry. Yes, the rain was really that heavy. If you want a fantastic explanation of what a convergence zone is, check out Scott Sistek's page on it here.

We'll have some rain coming in Friday afternoon, but I'll bet my life on having a strong convergence zone somewhere in the area Saturday afternoon due to a cool, moist, onshore flow splitting around the Olympics and converging somewhere along Puget Sound. If I'm still alive on Sunday, you'll know I was right. :)

Charlie

Monday, April 8, 2013

Rainfall Totals From the Last Few Storms

Monday, April 8, 2013
1:02 P.M.

Photo credit: Wikimedia user "Rosendahl"
April is known for "showers and sunbreaks," which might as well become a trademarked phrase around here since it is probably the most commonly mentioned phrase in Seattle, meteorological or otherwise. Imagine how rich the original creator of that phrase would be if news stations and the National Weather Service had to buy rights to use it. That'd be an easy way to make a living.

This past weekend, though, we saw more showers than sunbreaks. In fact, we saw half an inch of rain on Saturday and an incredible, record-setting 1.54 inches of rain on Sunday. Scott Sistek of KOMO News (hands down the best station for weather news in Washington... nobody else even comes close) found that the 2.04 inches of rain that Sea-Tac saw this weekend made it the wettest April weekend since record-keeping began in 1948. Sunday was the fourth-wettest day ever in the month of April at Sea-Tac, and we absolutely demolished the previous record of 0.63 inches in 1984.

As of midnight Sunday, Sea-Tac has received 3.10 inches of rain for the month of April, which is over four times the normal amount by this date (0.74 inches) and slightly higher than the average total for the entire month of April, which is 2.71 inches. I have to give Scott Sistek and the KOMO weather page credit for these statistics... they are in the public domain, but the folks at KOMO sure saved me a lot of time searching for statistics. Scott's article can be found here, on his "Partly to Mostly Bloggin'" blog, which is only bested by my blog in terms of quality of information, writing skill, and overall content. Just kidding, his blog makes mine look like it should be drawn in crayon.

The artist was 1 year 10 months when this was drawn. Soft crayon on paper. Uploaded by parent. Photo credit:Wikimedia User "Monika Wirthgen/Menschliches"
The University of Washington is one of the premier schools in the galaxy for studying meteorology, and they've developed a nifty little tool called "Seattle RainWatch" with the Seattle Public Utilities. Here are some 72-hour rainfall totals over the area as estimated by the Camano Island WSR-88D radar.

72-hour precip from 11:56 PM 4/4/13 to 11:56 PM 4/7/13

Remember, this precipitation map is the precipitation as measured by the radar. The radar beam increases with height as it radiates outward from the Camano Island radar, so those places to the far south and west likely got more precipitation than the radar is showing. Also, you can clearly see the blocking effect that the Olympics and Cascades have on the beam in the above photo. In any event, there are extremely heavy 3-day precipitation totals over the region for April... it looks like some mountainous regions got over six inches during this span.

Here's another RainWatch graphic that is zoomed in on the Seattle area.

72-hour precip from 11:56 PM 4/4/13 to 11:56 PM 4/7/13

This graphic really shows how the precipitation was not evenly spread over the Puget Sound lowlands, especially the Seattle area. These look like slight over-estimates to me... I checked the UW rooftop data from the atmospheric sciences building and they only officially received ~2 inches for the period. Still, it gives a good general idea of the relative amounts of precipitation that fell over the area. It's interesting to note how much of Mercer Island and SODO was relatively drier than places north and south.

Will the wet weather end? No. I do not see any storms like the one we saw this past weekend on the horizon, but we do look to settle into a cool, unsettled pattern with showers, sunbreaks, and relatively low snow levels for this time of year, easily below pass level. It should be a great time to get some late-season turns in. I personally recommend the Alpental backcountry. Wait, nevermind, I don't want anybody messing up the perfect powder for me.

On another note, this is the time of year when we really start to see severe weather pop up in the nation's heartland. Joey Sipos snapped the below picture yesterday on his storm-chasing adventure in the middle of Kansas. Makes our storms look pretty pathetic.


Enjoy this period of extended chilliness while you can, because it ain't gonna be around forever.

Have a good one!
Charlie

Sunday, April 7, 2013

Sunday Surprise!

Sunday, April 7, 2013
1:03 P.M.

01:24 am PDT Sun 07 Apr 2013 - Langley Hill Radar

Last night, a surprisingly powerful storm rolled through the area. It's a shame that the brunt of it came while most people were sleeping, as I'm always down to watch a good storm, but I can get a glimpse of what it may have been like by looking at past radar and satellite images. And let me tell you, the storm that rolled through looked pretty legit.

If you take a look at the radar above, you can actually see the general form of the low pressure system. You can see the heavy rain ahead of the system, but the really amazing part is that little rain-free area off the coast. That area indicates the exact center of the low. Low pressure systems rotate counter-clockwise around their center in the northern hemisphere, and that little "hook" to the west of the rain-free area represents the front out ahead of the storm wrapping around to the west of the storm due to the counter-clockwise rotation of the low. This feature is known as the "bent-back occlusion," or, as Cliff Mass likes to call it, the "poisonous tail" of the low. In this system, the area of heavy rain centered over the Langley Hill radar looks to be much more poisonous, but in other systems, the bent-back occlusion is generally the area where the strongest winds are found. In the Hanukah Eve storm of 2006, many locations in Western Washington received their highest gusts a little after 1 A.M., right as the bent-back occlusion was coming through.

Here's a water vapor image of a strong bent-back occlusion back from February 4, 2006 just to give you an idea of what these features look like. The occlusion is to the west of the dry slot off the Washington coast.


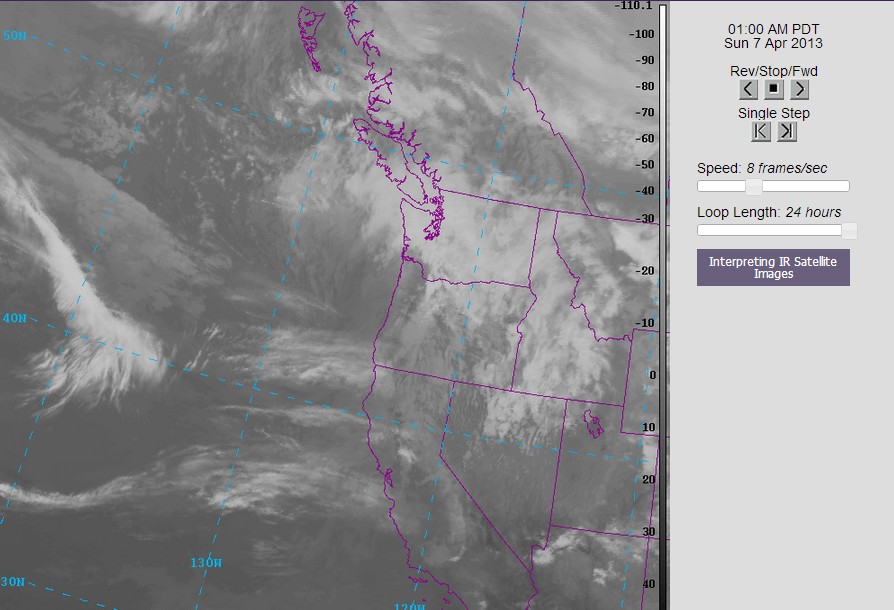
Although a small bent-back occlusion is visible on the radar, it wasn't picked up very well on the satellite. Take a look at the infrared satellite picture I posted below, and try to find the occlusion.


If you look really closely, you can see the curl of the cold front extending upwards through the Willamette Valley before it turns into an occlusion and bends back down to the south off the Washington Coast. I put a satellite loop below. Try to see if you can find the time where the low undergoes cyclogenesis and develops the occlusion.


If you can, you are well on your way to becoming a meteorological genius. If you can't, just keep practicing.

 The models had hinted at a storm like this, but the details were tremendously muddy. I decided to take a look at the forecast discussion from the Portland NWS office Friday night, and here's what they had to say.


  MODELS ARE HAVING TREMENDOUS DIFFICULTY IN HANDLING THE NEXT SYSTEM 
  FOR SATURDAY NIGHT. GIVEN THE UNCERTAINTY WILL ISSUE A LOW-END WATCH FOR THE OREGON 
  COAST WITH THE AFTERNOON PACKAGE AND INCLUDE POSSIBLE GUSTS TO 60 MPH 
  ACROSS THE MORE EXPOSED COASTAL SITES.


The gusts ended up being higher than forecast, and the Willamette Valley, which was just expected to be breezy, was issued a wind advisory last night in accordance with the rapidly developing low. Off the Oregon Coast, Cape Foulweather had sustained winds to 46 mph with a gust to 75, the Yaquina Bay Bridge (near Newport, OR) had sustained winds of 50 with a max gust of 60, Timberline had a gust of 89, and even Portland had a gust to 44. Pretty impressive stuff. If you look at Saturday night's model run, you can see the tight, tight, tight gradient across the Willamette Valley.

Valid 05:00 am PDT Sun, 07 Apr 2013 - 12hr Fcst: UW 00z WRF-GFS: 12km 10-meter wind speed, sea-level-pressure

If you got the Tuco reference, you are well on your way to becoming a methamphetamine drug lord. If you didn't, just keep practicing.

This storm is in some ways reminiscent of the February 7, 2002 "South Valley Surprise," which you can read more about here. This is Wolf Read's "The Storm King" website, which is a great resource for learning about Pacific Northwest windstorms and reading about past events. The South Valley Surprise was a storm that hit south-central Oregon with essentially no warning and was much more severe than this one.

It also reminds me of the big snowstorm we saw in January of 2012 where a low was forecast to move to our south, leaving us snowless, but ended up coming further north, bringing Seattle a good six inches of snow and burying places like Centralia in 1-2 feet of the white stuff. Needless to say, I got this forecast right on the button... check out the "Models Pessimistic, Charlie Optimistic" blog under recent posts. Even in high school, I was the best forecaster in Washington for snow events. Don't believe me? Ask anybody at Garfield about that snowstorm with the huge bolt of lightning. They'll vouch for me.

Charlie