Friday, December 23, 2011

Update on the Pattern Change

Friday, December 23, 2011
10:04 A.M.

This will be a rather short post, as little has changed and my internet at home is so slow that it is not practical to even attempt to look at a variety of model charts. The pattern change still looks to be on tap, which is fantastic to see.

Valid 04:00 am PST Fri, 23 Dec 2011 - UW 12z 36km WRF-GFS 500mb vorticity, heights

The above chart shows the heights at the 500mb level of the atmosphere when the 12z WRF-GFS model was initialized, which was 4 A.M. PST this morning. You can see that although the flow is gradually becoming more zonal, there is still a large ridge over our area. Thankfully, this ridge will start to flatten and collapse, and numerous storms will start to impact the Pacific Northwest. None of these storms look particularly strong at this point, but they will help to build up some snowpack in the mountains. 

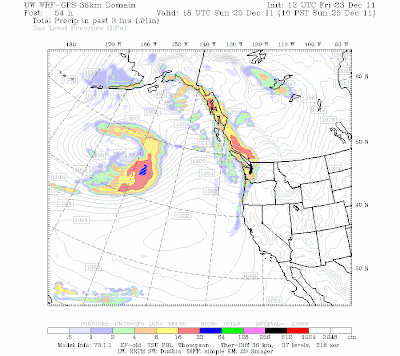
Our pattern change will begin with a rather weak  front on Christmas Day. We will see a bit of light rain. and it may get breezy along the coast. The most significant thing about this storm is that it will be the first storm in a series of storms that will roll through our area.

Valid 10:00 am PST Sun, 25 Dec 2011 - 54hr Fcst - UW 12z 36km WRF-GFS 3-hour precip, SLP

Also, take a look at the 500mb chart, and look at how the flow is much more zonal as the ridge has weakened and moved south.

Valid 10:00 am PST Sun, 25 Dec 2011 - 54hr Fcst - UW 12z 36km WRF-GFS 500mb vorticity, heights

After this weak storm passes through, we will start seeing some moderate storms as the flow becomes even more zonal. 

Valid 01:00 pm PST Wed, 28 Dec 2011 - 129hr Fcst - UW 12z 36km WRF-GFS 500mb vorticity, heights

I'm excited that we will finally see some change around here! Even my mom is starting to get bored with the weather...

Charlie

Wednesday, December 21, 2011

Stonehenge

Wednesday, Winter Solstice, 2011
12:34 P.M.

Stonehenge in the snow! Picture taken January 7, 2010, from Reuters.

Since it is the winter solstice, I thought I'd write today's blog post on Stonehenge. As it turns out, Stonehenge was not just built by some strong dumb guys who wanted to prove to the world that they knew what a circle was. Stonehenge has a famous stone, called the "Heel Stone," which was used to find the exact date of the summer solstice. Of course, the people who built Stonehenge knew of the seasons, but by creating Stonehenge and the Heel Stone, they were able to offer visual confirmation of the day of the summer solstice.

Picture Credit: Mystical Realms

The Heel Stone is not in the center of Stonehenge; rather, it is 256 feet away from the "center" of Stonehenge.  Here, it is marked as the "Helestone." It's the same thing. There are also five other "station stones," and while I don't know the exact purpose of these stones, four of them create a rectangle, and the diagonals from each corner meet in the exact center of Stonehenge. The sides of the rectangle also have what English astronomer Gerald Hawkins called "astronomical significance." I'm not going to get into all the other amazing things about Stonehenge in this blog, but be assured that these "station stones" are not just randomly placed.

Picture Credit: Mystical Realms

Let's look at some actual pictures of the Heel Stone! In the simulation below, the Heel Stone is in the left portion of the foreground. Stonehenge and one of the station stones can be seen in the distance.


Now, take a look at this next image. Looking from the center of Stonehenge, the sun is rising directly over the Heel Stone. Isn't that incredible! Again, this image is a computer simulation, but I did find some other good pictures of sunrises over the Heel Stone during the summer solstice.


These other pictures aren't from within the center of Stonehenge, but the people are in the northeast line of sight from the center of Stonehenge to the Heel Stone, so the effect of the sun rising directly over the Heel Stone is preserved.

June 21, 2011. Photo credit: eclipsegeeks.com

Look at all those Stonehenge geeks! There are lots of fences around the Heel Stone, it is a pretty special chunk of rock.

Photo credit: Dr. Terence Meaden

The picture above shows the shadow cast by the Heel Stone, and as you can see, the shadow goes directly into the center of Stonehenge and matches perfectly with the simulated picture I showed you earlier!

Weatherwise, the forecast for change is still on track. The models are inconsistent on the details, but we will finally see some more interesting weather move through the Pacific Northwest.

That post took me exactly one hour! Have a nice solstice! The worst has passed. :)

Charlie

Tuesday, December 20, 2011

Actual Pattern Change!

December 20, 2011
4:55 P.M.


A week and a half ago, I posted a big blog about how things were gonna change. We were gonna get out of this inversion, get some rain in the lowlands, and start building some serious snowpack in the mountains.


Like Obama, not much ended up changing. I love Obama and I think he's doing a great job, but it's so hard to get anything done in our current political climate. He's sure doing a lot better than Bush, but that isn't saying much.

But I'm convinced now that we will see some actual change in the weather. First, take a look at the 500mb thickness and vorticity charts from the UW WRF-GFS model run this morning.

Valid 04:00 am PST Tue, 20 Dec 2011 - UW WRF-GFS 12z 36km 1000-500mb thickness, SLP

Valid 04:00 am PST Tue, 20 Dec 2011 - UW WRF-GFS 12z 36km 500mb vorticity, heights

When the chart was initialized, we were under a weak ridge of high pressure. Initially, we won't see much change. In fact, the high may grow stronger tomorrow. A weak system will come through on Thursday, but it won't do much other than bring some clouds to the region, and Seattle will probably remain dry. On the chart, you can see some lower thicknesses over the Pacific Northwest though, signaling that lower pressure is in fact upon us.

Valid 01:00 am PST Fri, 23 Dec 2011 - 69hr Fcst - UW WRF-GFS 12z 36km 1000-500mb thickness, SLP

After this, that pesky little ridge builds again through Saturday. But on Saturday, everything is going to change. A relatively strong low pressure system will head up around Vancouver Island, giving us breezy conditions and a shot of rain.

    Valid 01:00 am PST Sun, 25 Dec 2011 - 117hr Fcst - UW WRF-GFS 12z 36km 3-hour precip, SLP

The significant thing about this storm is that it will finally break down the ridge, opening up the door for Pacific storms to roll into our region. One last picture... take a look at another 500mb chart that shows height lines and overall vorticity in the atmosphere. Don't worry about the vorticity part... but take a look at how close together the height lines are over our region, and compare this to the picture I showed earlier. The flow is much more zonal over our region, meaning that the upper-level winds are flowing directly from east to west instead of having wave-like undulations in them caused by ridges of high pressure. 

Valid 10:00 am PST Sun, 25 Dec 2011 - 126hr Fcst - UW 12z 36km 500mb vorticity, heights

That is a very encouraging sign to see! We will finally get some weather that will be more active. The 18z GFS model actually showed some pretty heavy rain over our area on Christmas Day, but I'm not going to show it because it is a global model and offers very little resolution for our specific area. That's why I love the UW models; they take the big GFS model and give it a lot more detail for our specific area.


Let's make Barack Obama proud!

Charlie Phillips
Monday, December 19, 2011

Southern Plains Snowstorm!!

Monday, December 19, 2011
3:55 P.M.

Santa Fe - December 19, 2011 - Photo Credit: AP Photo/The Albuquerque Journal, Dean Hanson
I've been trying to find creative things to write about on this blog, but I haven't had the creativity because of finals week, and I haven't found anything interesting about the weather either. The weather should be stormy and snowy this time of the year, but right now, it is about as interesting as watching a banana take a nap. Therefore, I'll talk about a pretty big storm we are seeing over the Midwest.

03:15 pm PST Mon 19 Dec 2011 - East Coast Infrared Satellite

This isn't a major storm, but it is significant, and it will impact holiday travel. Some places northwest of the center of the low will get well over a foot of snow, and other places will get heavy rain. Take a look at the radar below, and look at Kansas City! There are some reds in there! Kansas City could get up to three inches of precipitation from this storm. They are getting rain right now, but will probably switch to snow later tonight as the low heads east and Kansas City will get some colder, northerly winds.

05:04 pm PST Mon 19 Dec 2011 - Central U.S.1800-Mile Radar

Some places are also seeing quite strong winds. The sustained winds north of the low are around 30-40 mph in places, with higher gusts.

05:11pm PST Mon 19 Dec 2011 - Central U.S.1800-Mile Radar

Snow and strong winds? I'm sure you know what that means...


The National Weather Service has issued blizzard warnings in southeast Colorado, northeast New Mexico, the Texas and Oklahoma panhandles, and eastern Kansas. The blizzard warnings are marked as orange, and the other colors mark winter storm warnings or advisories.

Even though this storm is bad now, it is expected to die out in the next day or so as it loses upper-level support. Still, it will drop some serious snow and create some dangerous travel conditions before it is all said and done. It has already killed two people. Let's hope there are no other casualties.

The weather for us? Boring. Kind of like Nascar.

Charlie Phillips

Wednesday, December 7, 2011

Pattern Change?

Wednesday, December 7, 20111:05 P.M.


The weather around here for the past ten days has been incredibly boring. I'd venture to say it has been even more boring than hundreds of left turns on the Nascar track. Sorry Nascar fans.

But there is some good news! The models have been moving toward a pattern change in the extended forecasts, and while it is too early to pin down any details, the models are coming to a consensus that we will finally break out of these constant inversions next week and have some systems come through the area. And one model has been showing a possibility of a four letter word that begins with 's' next week. Oh, and the second letter is 'n' (just to clear things up).

Here is the European model 500mb thickness with sea-level-pressure chart from this morning. This chart was valid at 4 A.M. this morning.


Check out the chart a week later, though! This is the 168 hour forecast.


The ridge has finally moved west, opening up the door for some cooler air and storms.

One interesting thing in the UW WRF-GFS model this morning was that some lowland snow is shown for our area in a week or so. I'm not giving it too much thought though. Seattle forecasters have enough trouble pinning down snow for the next day, let along the next week. It does look like we will transition to a wetter period with cool temperatures though, so lowland snow is definitely a possibility. It's that time of year!

Thanks for reading, I have to rush off to class.
Charlie

Tuesday, December 6, 2011

Air Quality

Tuesday, December 6, 2011
10:10 A.M.

Queen Anne Hill looking downtown: KIRO7 webcam

This has to be a lightning quick post, but that is ok because there is not much going on weather-wise right now. Take a look at the webcam above looking downtown. Look at all that gross haze! Ugh... I hate that type of weather. 

Thankfully, you can escape this weather if you head up in elevation. It will also be warmer. Yesterday, Paradise, at 6,000 feet on Mt. Rainier, got up to 51 degrees. Meanwhile, Tacoma reached 37 degrees.

Paradise: Mt. Rainier: December 6, 10:00 A.M.

Bottom line: if you want clean, warm air, climb a mountain.

Gotta go! Sorry for the brevity.
Charlie

Monday, December 5, 2011

A Huge Inversion

Monday, December 5, 2011
10:20 A.M.


Hi everybody. Sorry for not writing the past few days, my computer has been at the shop and I haven't had access to one. I am writing this post at the library and I need to be sitting down in a class in nine minutes, so this will be a very short post.

Right now, we are under a gigantic inversion. Take a look at the temperatures taken from the Sand Point profiler at 9 A.M. this morning. In many spots, the air temperature actually increases with height, showing that an inversion is above us. This means that we get air pollution, fog, and relatively cold temperatures compared to places with higher elevation. Want to escape the cold and smog? Head up to Tiger Mountain.

Remember that arctic blast threat I was talking about? The models are now in consensus that we will not see a full-on blast. We will be chilly, but we will not be frigid. It was exciting to see, but it was super far out, and model accuracy declines rapidly with time, especially after 120 hours. The models are in agreement that this cold air will head further east.

This pattern of rather mundane weather looks to continue into next week.

Got to go!
Charlie

Thursday, December 1, 2011

A Record Day at Sea-Tac

Thursday, December 1, 2011
12:42 P.M.

Sound like you? Actually, all of us have been under a lot of pressure lately. While the weather outside seems mundane (and believe me, it is), Sea-Tac has seen the highest pressure readings since observations began there in 1948 over the past 12 hours.

The below figures show the highest pressures recorded at Sea-Tac, and the times are in UTC. This means that Sea-Tac set its record for high pressure at midnight on December 1, since PST is 8 hours behind UTC. I took this off of Cliff Mass' blog

year    month   day    hour (UTC)  pressure (mb)
2011 12    01   08        1043.4
2011 12    01   07        1043.3
2011 12    01   09        1043.2
2011 12    01   10        1043.2
2011 12    01   11        1043.1
1949 01    28   16        1043.0
1949 01    28   17        1043.0
1949 01    28   14        1042.7
2011 12    01   06        1042.6
1949 01    28   13        1042.3
1949 01    28   15        1042.3
1949 01    28   18        1042.3
1949 01    28   19        1042.3
1957 01    16   10        1042.3
1957 01    16   11        1042.3

We demolished the old pressure record. Also, these are preliminary; the pressure this morning after midnight was still higher than some of the old records. While the weather is pretty boring here, it is record-breaking. Funny how that works, isn't it?

Also, take a look at the current surface weather analysis over the West Coast.

Valid 04:00 am PST Thu, 01 Dec 2011 - NWS West Coast Surface Analysis

Look at that 1047 mb high pressure center over the Okanogan! Absolutely incredible. Boring, but incredible.

On another note, the new models came out this morning, and they are still pointing to a cold snap the middle of next week. Cliff Mass gave me a good rule of thumb today, saying that you shouldn't really get excited about anything beyond 120 hours. This event is still beyond 120 hours, but honestly, I am gaining some confidence in it. If it is still present in the models a couple days from now, we should worry about arctic air spilling into the region. I get excited when the models point to something interesting, but I also know that beyond 120 hours, they aren't very accurate.

I'll go ahead and show you what I am seeing on them. You'll probably see why I am so happy with the models after I show you these pictures.

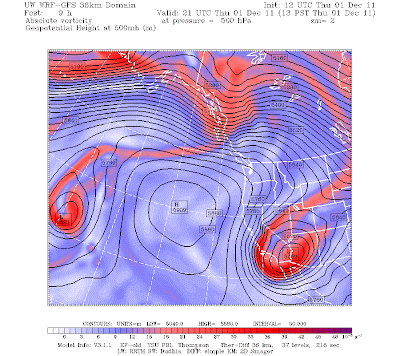
As of now, I am pretty confident that this huge ridge of high pressure we are seeing will drift off to the west. Here is the 500mb chart from this morning. The main thing to look for is the huge ridge over the Eastern Pacific.

Valid 01:00 pm PST Thu, 01 Dec 2011 - 9hr Fcst - UW 12z 36km 500mb absolute vorticity, heights

72 hours later, it is much further west.

Valid 01:00 pm PST Sun, 04 Dec 2011 - 81hr Fcst - UW 12z 36km 500mb absolute vorticity, heights

By the 120 hour forecast, it is even further west, and a trough is approaching the Pacific Northwest.

Valid 04:00 am PST Tue, 06 Dec 2011 - 120hr Fcst - UW 12z 36km 500mb absolute vorticity, heights

Let's take a look at the surface temperatures at this time.

Valid 04:00 am PST Tue, 06 Dec 2011 - 120hr Fcst - UW 12z 36km 2m temp, 10m winds, SLP

You can see a bunch of very cold air shifting towards us. Again, this is at 120 hours. 

But what happens in the hours beyond this is what is truly exciting.

Valid 04:00 am PST Wed, 07 Dec 2011 - 144hr Fcst - UW 12z 36km 2m temp, 10m winds, SLP

Look at all that cold air! There are very strong gradients by the Fraser River Valley, so Bellingham would get blasted with high winds if this were to occur.

And finally, 168 hours out - the day 7 forecast.

Valid 04:00 am PST Thu, 08 Dec 2011 - 168hr Fcst - UW 12z 36km 2m temp, 10m winds, SLP

That is some frigid air. And you don't even want to know about Montana.

But, alas, it is beyond 120 hours. I will be watching the models closely to see if this comes true. 

Charlie