Saturday, November 23, 2013

Cold Nights and Our Urban Heat Island

Saturday, November 23, 2013
5:43 pm

This picture was taken at Joint Base Lewis-McChord last November by YouNews contributer Jilma V.Diaz-Demangue and was retrieved with permission from KOMO's website.

Isn't that a beautiful picture above? It looks to be some sort of Japanese Maple leaf. I have one of those trees in my backyard, and they are stunningly beautiful any time of year. Of course, living in Washington, I've seen a lot of similarly-shaped leaves in the news recently.

Our last few days have had some pretty nice, albeit chilly, weather. We didn't have a massive arctic outbreak, and most engines were able to start up just fine in the morning. Rest assured though, if you left a glass of water outside one of the last few nights, you would wake up to find a layer of ice covering it. If you happened to live in Bremerton, Olympia, or, god forbid, Mazama, the whole thing might of been frozen.

Why did this happen? Well, our normal, grey, westerly maritime polar air off the Pacific got displaced by some modified continental polar air from Canada. The bulk of this arctic air moved east, and the arctic air that did make it here warmed significantly due to adiabatic compression, but we got cold anyway. We had blazing sunshine because this air was really stable and dry. While our daytime highs were only slightly below normal because of our high solar insolation, our low insulation at night due to our lack of clouds allowed heat to escape very efficiently. The result? Very, VERY cold nights, especially in outlying areas.

Speaking of "outlying areas," it seems like we always here that phrase on TV when it comes to cold overnight lows. How many times have you heard: "Lows will drop into the 20s throughout the sound, but a few outlying locations might make it down into the teens"? You never hear about the outlying locations being warmer, that's for sure. Why is this?

Well, there's this phenomenon called the "urban heat island" (UHI) and it is responsible for keeping the nighttime lows of urban areas higher than those of rural areas. In the country, you've got vegetation, and in the city, you've got asphalt. It should be no surprise to you that a block of concrete can store more heat over the period of a day than a tree trunk. Therefore, when the sun sets, there is more longwave radiation radiated at night by urban areas than outlying areas without these surfaces that are very conducive to absorbing heat during the day.

It's not even just the materials involved, though. The skyscrapers downtown create an "urban canyon effect," providing multiple surfaces for which sunlight can be reflected and absorbed and thereby increasing the efficiency of which urban areas are heated during the day. Buildings also block wind, which limits convection and makes it harder for heat to freely escape. And let's not forget about just plain ol' heat being released. You aren't going to have much heat escape from an open barn door, and even though they say revolving doors are supposed to be efficient, when you take into account how many of them there are, things can get crazy.

OK, scratch that last part, but still, cars, factories, sewers, furnaces, fridges, and any sort of system from which heat can escape via ventilation or radiation contribute to the UHI. And the pollution from cities can form ozone, which is a VERY potent greenhouse gas and can locally trap heat. Put all of these things together, and you can see why "outlying areas" are generally colder at night than areas closer to the city.

Since the UHI is mainly caused by outgoing longwave radiation, the effect is MUCH more pronounced at night when there is no sunlight. Another fun fact about some UHI's is that some places downwind of them can have significantly higher amounts of rainfall than areas upwind of the city due to the increased convection and a localized area of low pressure over the city due to the city being warmer than its surroundings. These two factors provide the lift that is needed for cloud formation, and showers and thunderstorms can form downwind as a result.

Take a look at the pictures of NYC below. One picture shows the amount of infrared radiation (heat) emitted, and the other shows the amount of vegetation cover there is. Notice how much cooler the city is in places with vegetation. Even Central Park, located in Central Manhattan, is significantly cooler than the rest of the city, with the Jacqueline Kennedy Onassis Reservoir being particularly chilly.


 Thermal infrared satellite data measured by NASA'€™s Landsat Enhanced Thematic Mapper Plus on August 12, one of NYC's hottest days during 2012

For this reason, Seattle's all-time record low of 0 degrees Fahrenheit may stay "artificially" protected for the foreseeable future even when other stations break their all-time low-temperature records. Who knows... with global warming in full force by 2100, who knows if we will ever see below 0 temps at Sea-Tac?

Things look to be calm for the forseeable future. I hate to say it, but things could get smoggy. It looks like Los Angeles took all our weather!

Have a nice weekend,
Charlie

Monday, November 18, 2013

Umbrella Treason

Monday, November 18, 2013
12:47 p.m.

Replace "Capt. John Brown" with "Umbrella," and you're set. It's not like the umbrellas have any choice.

Seattlites are not supposed to have umbrellas, let alone use them. Hoodies, ponchos, rainboots, and the like are tolerable, but umbrellas are unofficially forbidden. So imagine my surprise when I walked outside my house onto the UW campus today and saw enough umbrellas to block out the little light that peeked through the thick nimbostratus layer there was. Granted, not everybody who goes to the University of Washington hails from Western Washington, but still, after living here for even two months, they should be able to catch on. I'm seriously considering making some obnoxious chartreuse signs and trying to pitch my message in the middle of Red Square. I'll make the Mormons look like chirping crickets.

Why the sudden influx of umbrellas? Rain, of course! Let's take a look at our current radar to see what exactly is happening out there.


As this 3:37 p.m. PDT radar image shows, there's nothing too exciting about our rain. No squall lines, no thunderstorms, no strange shapes. Just some globs of rain coming in off the Pacific. The snow levels are above the major passes with this system, but there are still Winter Weather Advisories in the Washington Cascades for 6 to 16 inches of snow above 4,000 feet. As far as driving conditions go, it's a good thing that the snow levels are above the passes, because just look at how effectively the Cascades are orographically enhancing the precipitation, and look at the rain shadows northeast of the Olympics and east of the Cascades.

When air rises and precipitation is enhanced, some air also has to sink to "balance out" the situation. I'll learn more quantitative methods of explaining this as my atmospheric science education advances, but let me paint a picture in your head for a second. You drive on over to Archee McPhee's and decide to place a Whoopee Cushion under the seat of a girl you are taking out for a first date to dinner at a decently nice restaurant... like a Red Lobster or something. For the record... I've tried this... it doesn't work. When the air in the Whoopee Cushion is subject to an external force (in this case, your date's bottom), it seeks the path of least resistance to equalize the pressure. In our weather case, when the air is forced upward by topography, this path of least resistance is downward, and downward movement warms and compresses the air adiabatically (meaning no heat is exchanged with the surrounding environment), meaning that the relative humidity becomes lower and clouds/precipitation are less likely to form. This is why the windward slopes of the Cascades/Olympics are wet and the leeward slopes are dry.

Diagram of a Rain Shadow. Created and Released into the Public Domain by Wikipedia Contributor "Bariot." Retrieved from Wikimedia Commons.

The 4/3 km resolution WRF-GFS model gives a great idea of how the rain shadow effect is manifested in our area by our local topography. Check out the graphic below, which is the 24 hour forecast ending at 4 a.m. Tuesday.


Valid 04:00 am PST, Tue 19 Nov 2013 - 24hr Fcst: http://www.atmos.washington.edu/~ovens/wxloop.cgi?mm5d4_ww_pcp24+//84/3

Look at how the precipitation seems to be a mold of the topography, with higher amounts where there is higher elevation on the windward slopes and then close to nothing as you transition into Central Washington. Amazing.

But it's not just this macroscopic shadow-ism that is at play. There are lots of local effects going on, especially in the Cascades. In the far eastern Skagit County Cascades due east of Mt. Vernon, a group of mountains is expected to pick up 5 to 10 inches of rain, while some valley a couple miles north of them might get a half inch. That's a HUGE spread. Pretty amazing.

Things look to be calming down for the rest of the week, and I don't see any storms in sight. In fact, I don't see much of anything in sight. So, for all you weather enthusiasts, now's the time to put away your phermometers and study your physics.

Enjoy the short days!!! They are only gonna get shorter!
Charlie

Thursday, November 7, 2013

The Landfall of Super Typhoon Haiyan

Thursday, November 7, 2013
8:17 p.m.

A visible satellite image of Super Typhoon Haiyan as it makes landfall Friday morning Philippine time. Credit: NOAA.

A few hours ago, Super Typhoon Haiyan, one of the strongest, and, pending further investigation, quite likely THE strongest tropical cyclone in recorded history not only at landfall but at peak strength at any moment in time, made landfall on the central coast of the Philippines. The Philippines are no stranger to powerful tropical cyclones and commonly receive 6-9 landfalls per year, but with 195 mph sustained winds at landfall and 235 mph gusts, a landfalling storm of this magnitude is unprecedented. The previous record for the windiest storm at landfall was Hurricane Camille, which made landfall near New Orleans in 1969 with sustained winds of 190 mph and a central pressure of 905 mb.

While there are currently no official pressure readings, NOAA estimated this morning (back on our side of the date line) that the central pressure of Haiyan was a staggering 858 mb. The previous lowest pressure ever officially recorded was 870 mb from Super Typhoon Tip in the Western Pacific in October 1979. Tip was also the largest tropical cyclone with a diameter of 1,380 miles. Haiyan is still extremely large, but it is much smaller than Tip: "only" 500 miles across (this still makes it one of the largest tropical cyclones ever recorded, though). However, a smaller storm means a more intense pressure gradient, and hurricane force winds extend out well over 50 miles from the center. Hurricane force winds are defined as sustained winds over 74 mph. Sea-Tac's all-time highest gust is 69 mph, and this was recorded just after 1 a.m. on December 15, 2006 as the most intense pressure gradient - the "bent-back occlusion" - of the famous/infamous Hanukkah Eve Storm swept through. Hurricane Wilma back in the historic Atlantic 2005 hurricane season had a central pressure of 882 mb. The bottom line is that if this estimate is verified, Haiyan will have absolutely shattered the record for the lowest pressure ever recorded at sea-level. Regardless, one thing's for sure... these pressure readings put our 970mb Hanukkah Eve peak reading to shame.

Infrared image of Haiyan further out at sea. Credit: NASA

This false color image gives a great idea of the structure of the storm. A common misconception is that extremely powerful typhoons have a symmetrical structure. This is only partly true. As you can see, the outer edges of the typhoon are not very symmetrical. This is due to rainbands, which are those long, elongated cloud bands you see on the periphery of the typhoon. As the distance to the eye decreases, the symmetry tends to increase. 

Take a look at the picture below. This is the same photo as the one at the top but is zoomed in. Notice how circular the eye is and how the shield of clouds is perfectly symmetrical around it.

Eye of the storm. Credit: NOAA

Pretty amazing, huh? Who knew that something so beautiful could cause so much destruction. I know you'll join me in praying for the very best for all those affected in one way or another by this storm.

Here's another infrared pic showing the symmetry of the strongest, inner parts of the storm. It's like a doughnut with a really small hole. That's my kind of doughnut.

Amazing symmetry. My tummy is growling. Credit: NOAA

Here's some radar imagery of Haiyan coming ashore. Look how freakishly heavy the rain directly to the south of the storm is! I can't even imagine what that, combined with 195 mph winds, would do to structures.

Radar image of Super Typhoon Haiyan a few hours after landfall, at 9:33 local time on November 8, 2013. Image http://climatex.ph via wunderground.com

Alright, stills are great, but let's take a look at some animated satellite pictures.

According to NOAA, Hurricane Katrina caused 81 billion dollars in damage (2005 USD). But the damage could have been much worse. Take a look at the animation below.

I got this one from The Weather Channel! http://www.weather.com/outlook/weather-news/news/articles/hurricane-katrina-satellite-animation_2010-08-25

Katrina was only a Category 3 when it landed, with sustained winds at a mere 125 mph. A Category 3 is still a huge storm, but that's a far cry from the Category 5 it was when it was just a few hundred miles south. Meanwhile, Haiyan kept its strength all the way in. The animation below doesn't show it actually making landfall because this story is so new in development and I wasn't able to find one, but the satellite pictures above show that it didn't decrease in intensity for one second.

It keeps its strength all the way through. Credit: NOAA

As I finish up this post, the diameter has decreased to 400 miles and I'm sure the winds have decreased substantially as well. Tropical cyclones weaken very quickly when they are cut off from warm water and encounter terrain. I'll keep you posted on details as they come!

Charlie

Friday, November 1, 2013

ATMOS 301: Thermodynamics of Moist Air

Thursday, October 31, 2013
10:00 p.m.

We've already gone through a couple of variables representing the amount of water vapor in the air. These are e, the partial pressure of water vapor, and T_v, the virtual temperautre, which is equal to 1/ε*T.

 There are some we haven't gone over though, so I'll go over them now.

3.) Mixing ratio


The mixing ratio is equal to the grams of water vapor over the kilograms of dry air. It is conserved if there is no condensation or evaporation.

4.) Saturation vapor pressure

The saturation vapor pressure e_s is the vapor pressure when the gas is in equilibrium with a plane surface of liquid water. In other words, it is when the fluxes of molecules across the liquid into the vapor and vise-versa are equal.


The saturation vapor pressure, like the amount of water vapor that air can hold, increases exponentially with increasing temperature.

5.) Saturation Mixing Ratio


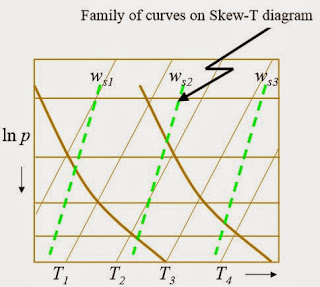
The saturation mixing ratio is the same thing as the mixing ratio except it assumes the given air parcel to be saturated. On the skew-t plot below, they are given by the green dashed lines. The skewed straight lines going to the right are lines of constant temperature, while the horizontal lines are lines of constant pressure. The thicker, slightly curved lines are dry adiabats. I know that I said earlier that air cools at a rate of 9.8 degrees K per km. It turns out that it's not quite a linear relationship.


6.) Relative Humidity

Relative humidity is equal to the mixing ratio divided by the saturation mixing ratio. Say, for example, that the mixing ratio is 3 and the saturation mixing ratio is 6. Then, the relative humidity is 50%.

7.) Dew point

The dew point is the temperature at which the air would have 100% relative humidity. In other words, the dew point is the intersection of the temperature and the saturation mixing ratio on a skew t chart.


8.) LCL (Lifting Condensation Level)


The LCL is the level to which an unsaturated parcel of air can be lifted dry adiabatically before it becomes saturated (with respect to a plane surface of pure water).

When the air is lifted, the mixing ratio w and the potential temperature θ remain constant, but the saturation mixing ratio w_s decreases until it is equal to w. This is because air cools with height when it is risen adiabatically. Therefore, the mixing ratio and the saturation mixing ratio have to meet at some point, and the LCL is that point.

After saturation, the air can no longer hold any more water, so as it cools and it can hold less and less, more and more has to be condensed out. w_s and w decrease at the same rate when a parcel is saturated and cools. Also, latent heat is released, so the change in thermal energy is NOT equal to 0. This leads us to...

9.) Moist Adiabatic Lapse Rate

This is a big one, so listen closely. The dry adiabatic lapse rate is nearly constant. The moist one is not; it varies with temperature and pressure. As I stated above, latent heat is released when water vapor condenses, so it makes sense that this lapse rate would be less than the dry adiabatic lapse rate. It ranges from around 4 degrees C/km in warm, humid environments at the surface to 7 degrees C/km in the middle troposphere.


So if latent heat is released, why do we still call this an adiabatic process? Well, sometimes, the air parcel which rose and had the water vapor condensed out of it can fall without any of the water droplets escaping, requiring them to form back into vapor so the parcel can become dry again. In that case, the process is completely adiabatic. Otherwise, you are indeed exchanging heat energy, and we call the process pseudoadiabatic.

The picture below shows the temperature, saturated mixing ratio, dry adiabat, and moist adiabat lines on a skew t with temperature on the x-axis and pressure on the y-axis.


10.) Level of Free Convection (LFC)

The level of free convection of the atmosphere is the altitude above which the temperature of the environment decreases faster than the moist adiabatic lapse rate of a saturated air parcel at the same altitude. It is a function of the amount of moisture in the rising parcel of air and the environmental lapse rate.

In the picture below, the LFC is found by finding the LCL of the air and then raising the air moist adiabatically until it reaches the same temperature as the environment. After it reaches this level, the air is free to rise because it has a lapse rate that is lower than the environmental lapse rate. This leads to convective clouds (ex: cumulus and cumulonimbus... NOT stratus)


The picture above shows a sounding in a conditionally unstable environment, which means the environmental lapse rate, or how much the air changes with height in the atmosphere, is between the dry and moist adiabatic lapse rates. The slope of the environment temperature sounding (T) has a steeper slope than the dry adiabat but a more gradual one than the moist adiabat. Keep in mind, however, that the temperature decreases with height/pressure more with the dry adiabat... we just have temperature on the x axis. The parcel (red) lifted from the surface (p1) changes its temperature T at the dry adiabatic lapse rate of 9.8 degrees C/km parallel to the dry adiabats and keeps its dewpoint T_d parallel to the saturation mixing ratio lines until the LCL. The parcel then changes both T and T_d to the moist adiabats.

It is colder than the environment below the LFC and warmer (and therefore buoyant) above.

I'm not Walt Whitman, nor do I aim to be. This is, first and foremost, a study guide. Still, if you're not studying meteorology, you could study this with the aim of conversation topics for first dates.

"Hmm.. nice day today... what do you think the LFC is?"

Charlie