5:57 a.m.

There's a lot of things that suck in life. I'm not quite sure if I've gotten any sleep tonight, and that definitely sucks. But there is something that sucks even more than not being able to fall asleep, and that is called an "omega" block. The "omega" stems from the configuration of the 500mb heights in the atmosphere.
First, let's review what a capital omega looks like.
 |
| Here ya go. |
Here is a capital Omega, the 24th and last letter of the Greek alphabet. Taking so many math and science classes, I get enough of these guys as is.
Below is an idealized diagram of the aforementioned block that I retrieved through UCAR's MetEd program. The program is free and is a great resource for not only weather enthusiasts but for those involved in larger educational and commercial fields. Check it out.

Now, take a look at a NAM chart all the way back from 2006. You can clearly see two closed lows on either side of a large ridge of high pressure.
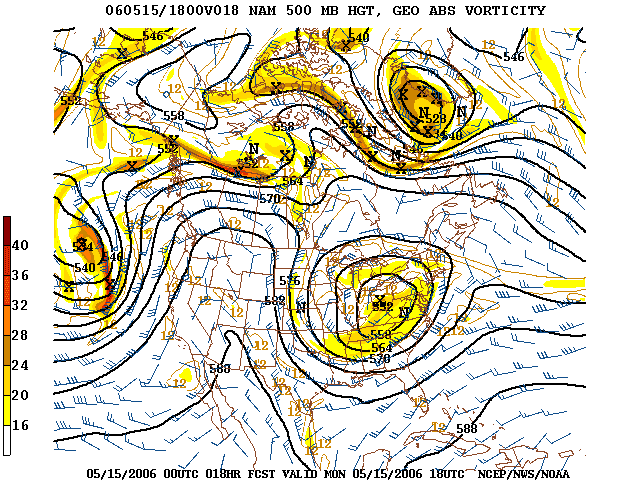 |
| A NAM representation of an Omega Block over the United States back in May of 2006. Created by NCEP. Retrieved from Wikimedia Commons. Chart URL: http://en.wikipedia.org/wiki/File:NAM_500_MB.PNG |
See the correlation? Omega Blocks actually look pretty cool on models, but they will give any storm chaser a nightmare. Or two. Or three.
The reason? Once these blocks come up, they are stubborn as heck. Here's the chart for today:
It's not a "classic" Omega Block; it only has a closed low to the west of the high. Still, there is a very large trough to the east of the high, and the whole chart definitely still looks like it should be plastered on the outside of a fraternity. As I write this this sentence, it's actually 5:55 p.m. in the KOMO weather center (I was finally able to fall asleep at around 7), so let's take a look at this morning's 12z WRF-GFS 500mb height charts.
 |
| Valid 05:00 am PDT, Fri 18 Oct 2013: 500mb Heights, Absolute Vorticity. UW WRF-GFS 36km Resolution: Initialized 12z Fri 18 Oct 2013. Retrieved from the Pacific Northwest Environmental Forecasts and Observations website. Model URL: http://www.atmos.washington.edu/~ovens/wxloop.cgi?mm5d1_x_500vor+///3 |


The above WRF-GFS charts show the Omega Block breaking down. To the untrained Pacific Northwest storm lover, this may look like good news. But in actuality, it's the worst thing that could happen. Why? Because a "Rex Block" will take its place.
This block does not resemble some brain-dead bloodthirsty beast, even if I do when one is situated over the area. Rather, it is named after Dr. Daniel F. Rex, a Commander in the Office of Naval Aerology and one of the founders of the NCEP (National Center for Environmental Prediction), which is the organization that develops and executes many different models that the United States (and many other countries around the world) use. Simply stated, a rex block has a high situated on top of a closed low. These blocks are even more stubborn than omega blocks. Let me put it this way... an omega block is to a filibuster as a rex block is to a government shutdown. And they will most definitely give any storm chaser a nightmare. Or four. Or five.

Let's take a look 180 hours in the future, which is the furthest the WRF-GFS goes out. Viewer discretion is advised.
 |
| Valid 05:00 pm PDT, Fri 25 Oct 2013 - 180hr Fcst: 500mb Heights, Absolute Vorticity. UW WRF-GFS 36km Resolution: Initialized 12z Fri 18 Oct 2013. Retrieved from the Pacific Northwest Environmental Forecasts and Observations website. Model URL: http://www.atmos.washington.edu/~ovens/wxloop.cgi?mm5d1_x_500vor+///3 |
That's a rex block, no doubt about it. grrr...
If there's a silver lining, this thing will break down eventually, and when it does, we'll be in for a neutral November. And looking back at November 2006, I think we can all appreciate how exciting those can be. :)
Have a good one! (inside KOMO joke) ;)
Charles
2006 fall-winter weather events from OWSC website:
ReplyDeleteNovember was the windiest November since 1990. The strongest windstorm that month occurred on the 13th causing widespread damage from fallen trees. Significant wind gusts greater than 60 mph were recorded in several locations, Spokane 59 mph, 62 in Western Whitman County, and 71 in Moscow ID.
On November 28, cold air along with the help of the Puget Sound Convergence zone helped to produce snow from Everett south through Tacoma during the evening commute. Throughout the Seattle metro area wide spread traffic jams and delays lasting hours were a result of abandoned cars, numerous accidents, and people stuck in the snow. "Thundersnow" (lightning and snow) was also reported south and east of Seattle and it was reported that two lightning strikes hit separate airplanes flying. Quickly following the snow, cold air behind an arctic front moved south, bringing temperatures down into the low to mid 20's. The cold air kept the high temperatures below freezing and produced record low temperatures around the region in the nights following. Seattle recorded a record low of 18 breaking the previous record of 22 in 1975. Also, Mt. Baker broke its record for the most snow in a storm cycle with 98" over a 5-day period.
November Floods & Rain
A slow moving pineapple express storm in the beginning of the month brought heavy rains which caused 12 rivers to reach all-time record high flood crests, causing major floods in 11 counties in western Washington. Despite one of the driest summers, the lack of summer rainfall was quickly made up with above normal precipitation statewide. By the end of the month, Seattle (as recorded from Sea-Tac airport), Hoquiam, Stampede Pass recorded all-time record monthly precipitation totals. To put things in perspective, Seattle and Olympia had almost as much rain in the month of November as some of the wettest places on the coast average for November. Seattle also recorded a seasonal high of 18.61" for Autumn (Sept. - Nov.) breaking the old high of 17.08" set in 1955. All the rain caused extensive damage to Mt. Rainier National Park as rivers re-rerouted themselves. Main access roads, along with the Sunshine Point Campground, were washed out and numerous areas of the park received major damage. Widespread flooding prompted the governor to declare 11 counties federal disaster areas.
December Windstorm (The Hanukkah Eve Wind Storm of 2006)
The strongest windstorm to hit the Northwest since the Inauguration Day storm of 1993. A record pressure gradient of 22.3mb from Portland to Bellingham helped winds reach 60-80 mph along the coast, 40-70 mph for the western Washington Interior, and 70-113 mph in the cascades. Chinook pass recorded the highest wind gust of 113mph. There was widespread damage from downed trees, close to 1.5 million electrical customers lost power forcing electrical companies to bring additional support from states as far as Missouri. Several areas were with out power for over a week. A flash flood in Seattle was also associated with the storm which killed a woman who became trapped in her basement as water rushed into the room and jammed the door shut. A total of 15 fatalities were reported 8 of which were due to carbon monoxide poisoning from generators. The governor declared a state of emergency for 17 counties in western Washington. While western Washington received all of the attention, even eastern Washington was affected by the storm. Gusts greater than 50 mph were observed in many locations including, 56 mph in Spokane, 81 mph southwest of Moses Lake, and 88 near Moscow, ID.
Very interesting.
Nice post, Charlie! ~Shannon
ReplyDeleteThank you Shannon!!!
ReplyDelete