Friday, December 23, 2011

Update on the Pattern Change

Friday, December 23, 2011
10:04 A.M.

This will be a rather short post, as little has changed and my internet at home is so slow that it is not practical to even attempt to look at a variety of model charts. The pattern change still looks to be on tap, which is fantastic to see.

Valid 04:00 am PST Fri, 23 Dec 2011 - UW 12z 36km WRF-GFS 500mb vorticity, heights

The above chart shows the heights at the 500mb level of the atmosphere when the 12z WRF-GFS model was initialized, which was 4 A.M. PST this morning. You can see that although the flow is gradually becoming more zonal, there is still a large ridge over our area. Thankfully, this ridge will start to flatten and collapse, and numerous storms will start to impact the Pacific Northwest. None of these storms look particularly strong at this point, but they will help to build up some snowpack in the mountains. 

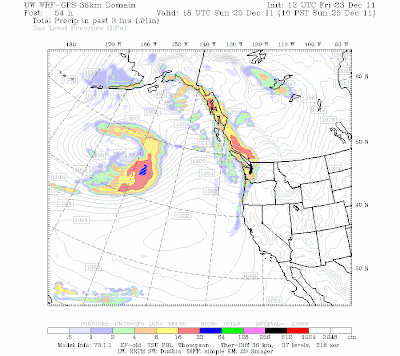
Our pattern change will begin with a rather weak  front on Christmas Day. We will see a bit of light rain. and it may get breezy along the coast. The most significant thing about this storm is that it will be the first storm in a series of storms that will roll through our area.

Valid 10:00 am PST Sun, 25 Dec 2011 - 54hr Fcst - UW 12z 36km WRF-GFS 3-hour precip, SLP

Also, take a look at the 500mb chart, and look at how the flow is much more zonal as the ridge has weakened and moved south.

Valid 10:00 am PST Sun, 25 Dec 2011 - 54hr Fcst - UW 12z 36km WRF-GFS 500mb vorticity, heights

After this weak storm passes through, we will start seeing some moderate storms as the flow becomes even more zonal. 

Valid 01:00 pm PST Wed, 28 Dec 2011 - 129hr Fcst - UW 12z 36km WRF-GFS 500mb vorticity, heights

I'm excited that we will finally see some change around here! Even my mom is starting to get bored with the weather...

Charlie

Wednesday, December 21, 2011

Stonehenge

Wednesday, Winter Solstice, 2011
12:34 P.M.

Stonehenge in the snow! Picture taken January 7, 2010, from Reuters.

Since it is the winter solstice, I thought I'd write today's blog post on Stonehenge. As it turns out, Stonehenge was not just built by some strong dumb guys who wanted to prove to the world that they knew what a circle was. Stonehenge has a famous stone, called the "Heel Stone," which was used to find the exact date of the summer solstice. Of course, the people who built Stonehenge knew of the seasons, but by creating Stonehenge and the Heel Stone, they were able to offer visual confirmation of the day of the summer solstice.

Picture Credit: Mystical Realms

The Heel Stone is not in the center of Stonehenge; rather, it is 256 feet away from the "center" of Stonehenge.  Here, it is marked as the "Helestone." It's the same thing. There are also five other "station stones," and while I don't know the exact purpose of these stones, four of them create a rectangle, and the diagonals from each corner meet in the exact center of Stonehenge. The sides of the rectangle also have what English astronomer Gerald Hawkins called "astronomical significance." I'm not going to get into all the other amazing things about Stonehenge in this blog, but be assured that these "station stones" are not just randomly placed.

Picture Credit: Mystical Realms

Let's look at some actual pictures of the Heel Stone! In the simulation below, the Heel Stone is in the left portion of the foreground. Stonehenge and one of the station stones can be seen in the distance.


Now, take a look at this next image. Looking from the center of Stonehenge, the sun is rising directly over the Heel Stone. Isn't that incredible! Again, this image is a computer simulation, but I did find some other good pictures of sunrises over the Heel Stone during the summer solstice.


These other pictures aren't from within the center of Stonehenge, but the people are in the northeast line of sight from the center of Stonehenge to the Heel Stone, so the effect of the sun rising directly over the Heel Stone is preserved.

June 21, 2011. Photo credit: eclipsegeeks.com

Look at all those Stonehenge geeks! There are lots of fences around the Heel Stone, it is a pretty special chunk of rock.

Photo credit: Dr. Terence Meaden

The picture above shows the shadow cast by the Heel Stone, and as you can see, the shadow goes directly into the center of Stonehenge and matches perfectly with the simulated picture I showed you earlier!

Weatherwise, the forecast for change is still on track. The models are inconsistent on the details, but we will finally see some more interesting weather move through the Pacific Northwest.

That post took me exactly one hour! Have a nice solstice! The worst has passed. :)

Charlie

Tuesday, December 20, 2011

Actual Pattern Change!

December 20, 2011
4:55 P.M.


A week and a half ago, I posted a big blog about how things were gonna change. We were gonna get out of this inversion, get some rain in the lowlands, and start building some serious snowpack in the mountains.


Like Obama, not much ended up changing. I love Obama and I think he's doing a great job, but it's so hard to get anything done in our current political climate. He's sure doing a lot better than Bush, but that isn't saying much.

But I'm convinced now that we will see some actual change in the weather. First, take a look at the 500mb thickness and vorticity charts from the UW WRF-GFS model run this morning.

Valid 04:00 am PST Tue, 20 Dec 2011 - UW WRF-GFS 12z 36km 1000-500mb thickness, SLP

Valid 04:00 am PST Tue, 20 Dec 2011 - UW WRF-GFS 12z 36km 500mb vorticity, heights

When the chart was initialized, we were under a weak ridge of high pressure. Initially, we won't see much change. In fact, the high may grow stronger tomorrow. A weak system will come through on Thursday, but it won't do much other than bring some clouds to the region, and Seattle will probably remain dry. On the chart, you can see some lower thicknesses over the Pacific Northwest though, signaling that lower pressure is in fact upon us.

Valid 01:00 am PST Fri, 23 Dec 2011 - 69hr Fcst - UW WRF-GFS 12z 36km 1000-500mb thickness, SLP

After this, that pesky little ridge builds again through Saturday. But on Saturday, everything is going to change. A relatively strong low pressure system will head up around Vancouver Island, giving us breezy conditions and a shot of rain.

    Valid 01:00 am PST Sun, 25 Dec 2011 - 117hr Fcst - UW WRF-GFS 12z 36km 3-hour precip, SLP

The significant thing about this storm is that it will finally break down the ridge, opening up the door for Pacific storms to roll into our region. One last picture... take a look at another 500mb chart that shows height lines and overall vorticity in the atmosphere. Don't worry about the vorticity part... but take a look at how close together the height lines are over our region, and compare this to the picture I showed earlier. The flow is much more zonal over our region, meaning that the upper-level winds are flowing directly from east to west instead of having wave-like undulations in them caused by ridges of high pressure. 

Valid 10:00 am PST Sun, 25 Dec 2011 - 126hr Fcst - UW 12z 36km 500mb vorticity, heights

That is a very encouraging sign to see! We will finally get some weather that will be more active. The 18z GFS model actually showed some pretty heavy rain over our area on Christmas Day, but I'm not going to show it because it is a global model and offers very little resolution for our specific area. That's why I love the UW models; they take the big GFS model and give it a lot more detail for our specific area.


Let's make Barack Obama proud!

Charlie Phillips

Monday, December 19, 2011

Southern Plains Snowstorm!!

Monday, December 19, 2011
3:55 P.M.

Santa Fe - December 19, 2011 - Photo Credit: AP Photo/The Albuquerque Journal, Dean Hanson
I've been trying to find creative things to write about on this blog, but I haven't had the creativity because of finals week, and I haven't found anything interesting about the weather either. The weather should be stormy and snowy this time of the year, but right now, it is about as interesting as watching a banana take a nap. Therefore, I'll talk about a pretty big storm we are seeing over the Midwest.

03:15 pm PST Mon 19 Dec 2011 - East Coast Infrared Satellite

This isn't a major storm, but it is significant, and it will impact holiday travel. Some places northwest of the center of the low will get well over a foot of snow, and other places will get heavy rain. Take a look at the radar below, and look at Kansas City! There are some reds in there! Kansas City could get up to three inches of precipitation from this storm. They are getting rain right now, but will probably switch to snow later tonight as the low heads east and Kansas City will get some colder, northerly winds.

05:04 pm PST Mon 19 Dec 2011 - Central U.S.1800-Mile Radar

Some places are also seeing quite strong winds. The sustained winds north of the low are around 30-40 mph in places, with higher gusts.

05:11pm PST Mon 19 Dec 2011 - Central U.S.1800-Mile Radar

Snow and strong winds? I'm sure you know what that means...


The National Weather Service has issued blizzard warnings in southeast Colorado, northeast New Mexico, the Texas and Oklahoma panhandles, and eastern Kansas. The blizzard warnings are marked as orange, and the other colors mark winter storm warnings or advisories.

Even though this storm is bad now, it is expected to die out in the next day or so as it loses upper-level support. Still, it will drop some serious snow and create some dangerous travel conditions before it is all said and done. It has already killed two people. Let's hope there are no other casualties.

The weather for us? Boring. Kind of like Nascar.

Charlie Phillips

Wednesday, December 7, 2011

Pattern Change?

Wednesday, December 7, 20111:05 P.M.


The weather around here for the past ten days has been incredibly boring. I'd venture to say it has been even more boring than hundreds of left turns on the Nascar track. Sorry Nascar fans.

But there is some good news! The models have been moving toward a pattern change in the extended forecasts, and while it is too early to pin down any details, the models are coming to a consensus that we will finally break out of these constant inversions next week and have some systems come through the area. And one model has been showing a possibility of a four letter word that begins with 's' next week. Oh, and the second letter is 'n' (just to clear things up).

Here is the European model 500mb thickness with sea-level-pressure chart from this morning. This chart was valid at 4 A.M. this morning.


Check out the chart a week later, though! This is the 168 hour forecast.


The ridge has finally moved west, opening up the door for some cooler air and storms.

One interesting thing in the UW WRF-GFS model this morning was that some lowland snow is shown for our area in a week or so. I'm not giving it too much thought though. Seattle forecasters have enough trouble pinning down snow for the next day, let along the next week. It does look like we will transition to a wetter period with cool temperatures though, so lowland snow is definitely a possibility. It's that time of year!

Thanks for reading, I have to rush off to class.
Charlie

Tuesday, December 6, 2011

Air Quality

Tuesday, December 6, 2011
10:10 A.M.

Queen Anne Hill looking downtown: KIRO7 webcam

This has to be a lightning quick post, but that is ok because there is not much going on weather-wise right now. Take a look at the webcam above looking downtown. Look at all that gross haze! Ugh... I hate that type of weather. 

Thankfully, you can escape this weather if you head up in elevation. It will also be warmer. Yesterday, Paradise, at 6,000 feet on Mt. Rainier, got up to 51 degrees. Meanwhile, Tacoma reached 37 degrees.

Paradise: Mt. Rainier: December 6, 10:00 A.M.

Bottom line: if you want clean, warm air, climb a mountain.

Gotta go! Sorry for the brevity.
Charlie

Monday, December 5, 2011

A Huge Inversion

Monday, December 5, 2011
10:20 A.M.


Hi everybody. Sorry for not writing the past few days, my computer has been at the shop and I haven't had access to one. I am writing this post at the library and I need to be sitting down in a class in nine minutes, so this will be a very short post.

Right now, we are under a gigantic inversion. Take a look at the temperatures taken from the Sand Point profiler at 9 A.M. this morning. In many spots, the air temperature actually increases with height, showing that an inversion is above us. This means that we get air pollution, fog, and relatively cold temperatures compared to places with higher elevation. Want to escape the cold and smog? Head up to Tiger Mountain.

Remember that arctic blast threat I was talking about? The models are now in consensus that we will not see a full-on blast. We will be chilly, but we will not be frigid. It was exciting to see, but it was super far out, and model accuracy declines rapidly with time, especially after 120 hours. The models are in agreement that this cold air will head further east.

This pattern of rather mundane weather looks to continue into next week.

Got to go!
Charlie

Thursday, December 1, 2011

A Record Day at Sea-Tac

Thursday, December 1, 2011
12:42 P.M.

Sound like you? Actually, all of us have been under a lot of pressure lately. While the weather outside seems mundane (and believe me, it is), Sea-Tac has seen the highest pressure readings since observations began there in 1948 over the past 12 hours.

The below figures show the highest pressures recorded at Sea-Tac, and the times are in UTC. This means that Sea-Tac set its record for high pressure at midnight on December 1, since PST is 8 hours behind UTC. I took this off of Cliff Mass' blog

year    month   day    hour (UTC)  pressure (mb)
2011 12    01   08        1043.4
2011 12    01   07        1043.3
2011 12    01   09        1043.2
2011 12    01   10        1043.2
2011 12    01   11        1043.1
1949 01    28   16        1043.0
1949 01    28   17        1043.0
1949 01    28   14        1042.7
2011 12    01   06        1042.6
1949 01    28   13        1042.3
1949 01    28   15        1042.3
1949 01    28   18        1042.3
1949 01    28   19        1042.3
1957 01    16   10        1042.3
1957 01    16   11        1042.3

We demolished the old pressure record. Also, these are preliminary; the pressure this morning after midnight was still higher than some of the old records. While the weather is pretty boring here, it is record-breaking. Funny how that works, isn't it?

Also, take a look at the current surface weather analysis over the West Coast.

Valid 04:00 am PST Thu, 01 Dec 2011 - NWS West Coast Surface Analysis

Look at that 1047 mb high pressure center over the Okanogan! Absolutely incredible. Boring, but incredible.

On another note, the new models came out this morning, and they are still pointing to a cold snap the middle of next week. Cliff Mass gave me a good rule of thumb today, saying that you shouldn't really get excited about anything beyond 120 hours. This event is still beyond 120 hours, but honestly, I am gaining some confidence in it. If it is still present in the models a couple days from now, we should worry about arctic air spilling into the region. I get excited when the models point to something interesting, but I also know that beyond 120 hours, they aren't very accurate.

I'll go ahead and show you what I am seeing on them. You'll probably see why I am so happy with the models after I show you these pictures.

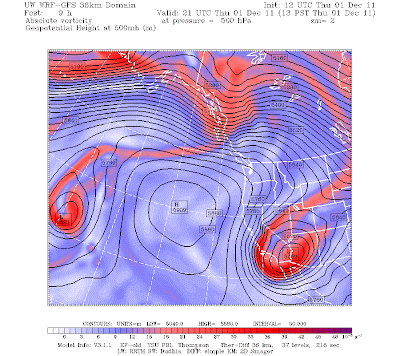
As of now, I am pretty confident that this huge ridge of high pressure we are seeing will drift off to the west. Here is the 500mb chart from this morning. The main thing to look for is the huge ridge over the Eastern Pacific.

Valid 01:00 pm PST Thu, 01 Dec 2011 - 9hr Fcst - UW 12z 36km 500mb absolute vorticity, heights

72 hours later, it is much further west.

Valid 01:00 pm PST Sun, 04 Dec 2011 - 81hr Fcst - UW 12z 36km 500mb absolute vorticity, heights

By the 120 hour forecast, it is even further west, and a trough is approaching the Pacific Northwest.

Valid 04:00 am PST Tue, 06 Dec 2011 - 120hr Fcst - UW 12z 36km 500mb absolute vorticity, heights

Let's take a look at the surface temperatures at this time.

Valid 04:00 am PST Tue, 06 Dec 2011 - 120hr Fcst - UW 12z 36km 2m temp, 10m winds, SLP

You can see a bunch of very cold air shifting towards us. Again, this is at 120 hours. 

But what happens in the hours beyond this is what is truly exciting.

Valid 04:00 am PST Wed, 07 Dec 2011 - 144hr Fcst - UW 12z 36km 2m temp, 10m winds, SLP

Look at all that cold air! There are very strong gradients by the Fraser River Valley, so Bellingham would get blasted with high winds if this were to occur.

And finally, 168 hours out - the day 7 forecast.

Valid 04:00 am PST Thu, 08 Dec 2011 - 168hr Fcst - UW 12z 36km 2m temp, 10m winds, SLP

That is some frigid air. And you don't even want to know about Montana.

But, alas, it is beyond 120 hours. I will be watching the models closely to see if this comes true. 

Charlie

Wednesday, November 30, 2011

Arctic Air Next Week?

Wednesday, November 30, 2011
1:01 P.M.


Yeah, I know No-Shave November is completely unrelated to weather. However, the model runs this morning made me hesitant about shaving my patchy, warming layer of facial hair. Remember how I was talking about how areas east of us would see very cold air next week due to the huge high pressure over our area creating a trough in the jet stream east of us where arctic air can invade? The big dome of high pressure is now forecast to move a little bit to the west next week or so.

If this holds true, we will see frigid temperatures, and if we have moisture, we will certainly see snowfall in the lowlands.

Take a look at the model from last night. I showed this picture in my previous blog post. The high is too far east for the Pacific Northwest to get cold air, but Montana would get frigid temperatures if this were to happen.

Valid 04:00 am PST Wed, 07 Dec 2011 - 180hr Fcst - UW 00z 36km WRF-GFS 1000-500mb thickness, SLP (last night's run)

This morning's run, just 12 hours later, is completely different. The high is further west, and Washington would be colder than a toilet seat in Siberia. Ok, maybe it won't be that cold, but high temperatures would be well below freezing, and low temperatures would be in the teens in Seattle with single digits in the suburbs.

 Valid 04:00 pm PST Wed, 07 Dec 2011 - 180hr Fcst - UW 12z 36km WRF-GFS 1000-500mb thickness, SLP

Look at that! Much colder air over our region, and the high is only slightly further west. This just shows the thickness of the atmosphere, where lower thicknesses generally equal colder temperatures since cold air is denser. Let's take a look at the surface temperature predicted at this time.
Valid 04:00 pm PST Wed, 07 Dec 2011 - 180hr Fcst - UW 12z 36km WRF-GFS 10m winds, 2m temp. SLP

In this picture, it is very cold over our region. There would also be strong winds through the Fraser River Valley as the cold arctic air spills into our region.
Valid 04:00 pm PST Wed, 07 Dec 2011 - 180hr Fcst - UW 12z 12km WRF-GFS 10m winds, SLP

Will this change? Absolutely. The models are not very accurate this far out. In fact, it could all change in tonight's run. However, it is interesting to see. Hopefully, it won't change. Models don't give us any moisture while we are this cold, but if moisture ever comes in, it will be in the form of snow for everyone.

Bottom line: don't get too excited yet, but there is hope for some interesting weather. 

Thanks for reading, and do some cold dances for me! Hopefully, you'll be doing snow dances next week. :)

Charlie

Tuesday, November 29, 2011

High Pressure, Inversions, and Fog

Tuesday, November 29, 2011
10:59 P.M.

Photo Credit: Kevin Ebi @ Living Wilderness

The next week or beyond will be very boring and uneventful for meteorologists. The culprit? A HUGE ridge of high pressure off the Eastern Pacific.

Take a look at the current atmospheric configuration from tonight's 00z UW WRF-GFS run.

Valid 10:00 pm PST Tue, 29 Nov 2011 - 6hr Fcst - UW 00z 36km WRF-GFS 1000-500mb thickness, SLP

There is a very, very strong ridge of high pressure over the Eastern Pacific. We have a weak system pushing through right now, but after that system passes through, we will be very dry, as this ridge will push the jet stream up north into Alaska, preventing any storms from reaching our area. Additionally, with light gradients over our area, cool, dense air will sink down to the surface and create an inversion, which is where the air at the surface is colder than the air aloft.

Inversions are very stable, and do not mix up the atmosphere much. Due to this lack of mixing, we often get fog and smog, as pollution gets trapped in the inversion over our area. People with asthma should be careful in the coming week, as they may encounter respiratory problems. People may also need to limit exercise or strenuous activity outside, as the air may irritate the lungs and make it hard to breathe.

This ridge ain't going anywhere. The extended WRF-GFS model at the UW goes out to 180 hours, and the ridge is still there and is stronger than ever.

Valid 10:00 pm PST Tue, 29 Nov 2011 - 6hr Fcst - UW 00z 36km WRF-GFS 1000-500mb thickness, SLP

While we are relatively warm aloft and cool at the surface, areas east of us will see numerous arctic outbreaks due to a huge trough in the jet stream. If this high was further west, we could be talking about some arctic air for our region. Alas, it is too far east. The plains should be very cold at times this coming week.

If you want to escape the haze, fog, and smog associated with this inversion, head into the mountains! The air will be warmer and cleaner. You'll look down at the Puget Sound lowlands and think "Was I really breathing that?" Inversions are gross... they indicate lame weather for us meteorology nuts while suffocating us all in dirty air. These inversions used to kill... the London smogs are a great example. Since then, people have burned cleaner materials (ex: natural gas as opposed to wood-burning stoves) and inversions now are much "cleaner" than they used to be in most places. Nevertheless, I'm not a fan.

Thanks for reading!
Charlie 

Monday, November 28, 2011

What a Convergence Zone!

Monday, November 28, 2011
4:22 P.M.

05:31 pm PST Sun 27 Nov 2011

Sorry for the lack of posts over the Thanksgiving weekend, I was at home and the internet there is dreadfully slow... so slow that it is impractical to use. And forget about using blogger...

Last night, we saw an incredibly well-defined convergence zone sweep through the region. Cliff Mass talked about this in the weather class I have with him, and he mentioned that one place north of Seattle recorded an inch of rain in an hour. That's an incredible amount of rain. The last time I witnessed something like that was on December 14, 2006, when a very strong squall dumped an inch of rain in an hour over Seattle.

The video below shows the rainfall in Seattle that night. As you can see, rainfall rates of an inch per hour are incredibly heavy, and are rare in the Seattle area.


You don't want to be biking through that!

This convergence zone could have been thought of as a "grand finale" for active weather in the Seattle area. November is coming to a close, and the last week of November, which is climatologically the stormiest time of the year for our area, is nearly past us. The next 10 days will be incredibly boring, as a HUGE ridge of high pressure parks just off our coast and stays there.

The ridge is already building right now, but after a weak system rolls through on Tuesday, this ridge will be in full-force.

Look at the size of this ridge by Wednesday afternoon.

Valid 07:00 pm PST Wed, 30 Nov 2011 - 63hr Fcst - UW 12z 36km WRF-GFS 1000-500mb thickness, SLP

This model shows the "thickness" of the atmosphere between the 1000 and 500 millibar levels in decameters. The thickness can be thought of as the difference in height between the two levels. This big ridge of high pressure warms the air aloft, making it less dense. Since the air is less dense, there is a greater distance between the 1000 and 500mb levels of the atmosphere, and hence, a greater 1000-500mb thickness. At the surface, the ridge is expected to be around 1040 millibars, which is disturbingly high pressure. I say "disturbingly" because pressure that high generally means that this ridge ain't going anywhere for awhile. Unfortunately for weather nuts like me, that looks to be the case.

Valid 01:00 pm PST Sun, 04 Dec 2011 - 153hr Fcst - UW 12z 36km WRF-GFS 1000-500mb thickness, SLP

Later this week, the ridge will grow even larger, pushing the jet stream up to the arctic circle. This spells atrociously boring weather for our region. Get ready for inversions, deteriorating air quality, and pretty bad sailing

Stay dry out there! It shouldn't be too hard...
Charlie

Thursday, November 24, 2011

Statistics From The Past Storm and Thanksgiving Travel Woes

Thursday, November 24, 2011
1:16 P.M.

November 23, 2011 - taken from KOMO News

I finally found some stats from the storm that hit us earlier this week. Below are some rainfall totals for areas in Washington from 7 A.M. Monday to 7 A.M. Wednesday. These statistics were taken off Scott Sistek's KOMO blog, "Partly to Mostly Bloggin'." It is a very good article about this storm, check it out here.

  • Anacortes: 1.05"
  • Auburn: 2.50"
  • Bainbridge Isl: 5.11
  • Bellevue: 2.32
  • Bellingham: 1.79"
  • Bothell: 3.00"
  • Bremerton: 4.92"
  • Burlington: 1.57"
  • Carnation: 2.13"
  • Concrete: 3.62"
  • Edmonds: 3.65"
  • Everett: 3.25"
  • Federal Way: 2.66"
  • Ferndale: 1.88"
  • Forks: 3.02"
  • Friday Harbor: 2.10"
  • Gig Harbor: 3.94"
  • Issaquah: 2.37"
  • Kent: 2.54"
  • Kingston: 4.56"
  • Kirkland: 2.85"
  • Lake Stevens: 2.88"
  • Lynnwood: 2.63"
  • Maple Valley: 2.10"
  • Marysville: 3.35"
  • Mercer Island: 2.89"
  • Montesano: 4.03"
  • Mount Vernon: 1.79"
  • North Bend: 2.88"
  • Ocean Shores: 4.04"
  • Olympia: 5.07"
  • Pakrland: 2.89"
  • Port Angeles: 3.89"
  • Port Orchard: 3.04"
  • Port Townsend: 1.32"
  • Poulsbo: 4.95"
  • Puyallup: 2.58"
  • Redmond: 2.42"
  • Renton: 2.09"
  • Sammamish: 2.33"
  • Seattle: 2.98"
  • Sequim: 3.75"
  • Shelton: 5.32"
  • Stanwood: 2.34"
  • Tacoma: 3.08"
  • Woodinville: 2.54"

I did some additional research, and found some additional rainfall statistics from the NWS office in Portland. These amounts were taken from 6 A.M. Monday to 8 P.M. Wednesday. It looks like the heaviest rain was concentrated in the Mt. St. Helens area, with June Lake getting 10.50 inches!!!

JUNE LAKE,WA...............10.50  ...THROUGH 8 PM...  
 SHEEP CANYON, WA...........9.70   ...THROUGH 8 PM...      
 CEDAR, OR..................9.00   ...THROUGH 8 PM...
 FRANCES, WA................8.70   ...THROUGH 8 PM...
 FOSS, OR...................8.36   ...THROUGH 8 PM...
 SPENCER MEADOWS, WA........8.00   ...THROUGH 8 PM...
 LONE PINE, WA..............7.90   ...THROUGH 8 PM...
 SOUTH FORK RAWS, OR........7.79   ...THROUGH 8 PM...
 LEES CAMP, OR..............7.60   ...THROUGH 8 PM...
 COUGAR, WA.................7.52   ...THROUGH 8 PM...
 SPIRIT LAKE, WA............7.00   ...THROUGH 8 PM...
 SURPRISE LAKE, WA..........6.40   ...THROUGH 8 PM...

This storm also packed a lot of wind, especially down in Oregon. I also got these statistics from the NWS office in Portland.

PEAK WIND GUSTS FOR TWO TIME PERIODS...
    FIRST ROUND TUESDAY THROUGH 815 PM
    SECOND ROUND BETWEEN 815 PM TUESDAY AND 615 AM WEDNESDAY
 --------------------------------------------------------------------
 
 LOCATION                      FIRST ROUND            SECOND ROUND
                            PEAK GUST TIME PST     PEAK GUST TIME PST 
 ---------------------------------------------------------------------
 SOUTH WASHINGTON COAST...
   CAPE DISAPPOINTMENT.......66 MPH  415 PM 11/22    75   130 AM 11/23
   TOKE POINT NEAR RAYMOND...43      612 PM 11/22    63  1218 AM 11/23
   OCEAN PARK................58      500 AM 11/22    48   915 PM 11/22
   LONG BEACH................40      426 PM 11/22    51   116 AM 11/23
 
 NORTH OREGON COAST...
   ASTORIA...................81 MPH  248 AM 11/22    56   200 AM 11/23
   PACIFIC CITY..............79      739 PM 11/22    74   233 AM 11/23
   CAPE MEARES...............74      623 PM 11/22    92   338 AM 11/23
   GARIBALDI.................69     1236 AM 11/22    81   300 AM 11/23
   CLATSOP SPIT..............64      700 PM 11/22    69  1015 PM 11/22
   ASTORIA AIRPORT...........61      413 PM 11/22    64  1155 PM 11/22
   TILLAMOOK (CITY)..........60      738 AM 11/22    53   244 AM 11/23
   SEASIDE...................60      803 PM 11/22
   CANNON BEACH..............62      507 PM 11/22
   TILLAMOOK AIRPORT.........54      155 AM 11/22    55   355 AM 11/23
   OCEANSIDE.................                        55  1044 PM 11/22
   TIERRA DEL MAR............                        58  1129 PM 11/22
 
 CENTRAL OREGON COAST...
   SEA LION CAVES............81 MPH  258 AM 11/22    
   FLORENCE SIUSLAW JETTY....76      140 AM 11/22
   LINCOLN CITY..............75      630 PM 11/22    76   951 PM 11/22
   CAPE FOULWEATHER..........74      450 PM 11/22
   NEWPORT (YAQUINA BRIDGE)..68      625 AM 11/22    71   439 AM 11/23
   YACHATS...................67     1220 PM 11/22    47   436 AM 11/23
   CAPE FOULWEATHER..........66      732 AM 11/22    66  1037 PM 11/22
   NEWPORT JETTY (C-MAN).....64      800 PM 11/22    51   200 AM 11/23
   NEWPORT AIRPORT...........59      715 AM 11/22    53   155 AM 11/23
   DUNES.....................53      804 AM 11/22
   GLENEDEN BEACH............66      853 AM 11/22
 
 COAST RANGE...
   MT. HEBO OREGON...........97 MPH  427 AM 11/22    85  1234 AM 11/23
   ROCKHOUSE RAWS............74      912 AM 11/22    57   612 AM 11/23
   JEWELL OREGON.............67      414 AM 11/22
   ROCKHOUSE RAWS............64      712 AM 11/22
   CEDAR CREEK RAWS..........55      710 AM 11/22    50  1110 PM 11/22
 
 INTERIOR LOWLANDS...
   MCMINNVILLE AIRPORT.......45 MPH  718 PM 11/22 
   SALEM AIRPORT.............40      900 AM 11/22
   MCMINNVILLE AIRPORT.......40      619 PM 11/22
   FOREST GROVE..............40      730 PM 11/22
   AURORA AIRPORT............39      900 AM 11/22
   EUGENE AIRPORT............36      327 PM 11/22
   PORTLAND AIRPORT..........35      845 AM 11/22
   VANCOUVER AIRPORT.........32      557 PM 11/22
   KELSO AIRPORT.............30      635 PM 11/22
 
  *WIND SPEEDS REPORTED IN MPH
 
Washington was very windy as well, but I couldn't find any statistics posted on the NWS Seattle page. Nevertheless, Bellingham had a gust to 70 miles per hour Tuesday morning, which is pretty incredible. Sea-Tac's all time highest gust was 69 miles per hour back in the Hanukkah Eve Storm of December 14-15, 2006.

Now, let's talk about the current weather situation.


The National Weather Service for Seattle has issued a ton of warnings for our incoming storm! Winter storm warnings for the Cascades, high wind warnings for the coast and north interior, and storm warnings for the offshore waterways into the Strait of Juan de Fuca, around the San Juan Islands, and heading up into the Strait of Georgia. Take a look at the satellite image below, and you'll see the storm that is currently causing all of this weather mayhem.

01:30 pm PST Thu 24 Nov 2011 - West Coast 8km resolution water vapor satellite

The storm, a mature 972 millibar low heading up into Northern Vancouver island, is much faster than the previous storm, so the rain should pass through in the next couple hours, and the winds will calm down rapidly everywhere by 10 P.M., with many locations improving sooner than that. For current Thanksgiving travelers, the biggest problem will be snow over the Cascades, which will not let up until Friday morning. The latest model from the UW indicates anywhere from 10-18 inches above 2,500 feet or so. 

Valid 04:00 am PST Fri, 25 Nov 2011 - 24hr Fcst - UW 12z 4/3km 24-hour snowfall

Snow has started falling in the Cascades, even at Snoqualmie Pass.


Snoqualmie Pass always seems to get hammered on Thanksgiving... I can remember writing blog posts in the past about this. If you must drive over the pass, drive slow, bring chains, and be prepared for delays.

Have a nice Thanksgiving!
Charlie Phillips