Wednesday, September 25, 2013

Biblical Rainfall Amounts in Colorado

Wednesday, September 18, 2013
4:13 a.m. (one of those nights...)

Hey everybody! It's super early Wednesday morning and I woke up and am having trouble falling back asleep. There are two things that make me fall asleep... writing weather blogs and reading the Bible. I'm not religious, I just want to read it because I'm curious about what it has to say and how this has been interpreted by people around the world, especially those in politics. I don't mean to offend anybody, but it's really boring... I haven't gotten out of Genesis yet. Moses was no Shakespeare. That doesn't make the Bible any less fascinating... it just means that it's not exactly the most riveting text in the world.

I heard about the Colorado floods when I was moving into my new house. I didn't have much time to write about them or even study them in detail, but in this post, I'll give an overview of what happened and why it happened. So without further ado, let's get to it!
__________________________________________________________

I still remember Seattle's rainiest day ever recorded. It was October 20, 2003, and I was a fifth-grader at McGilvra Elementary in Madison Park. We had a "rainy-day recess," and all of our activities were to take place either inside the school gymnasium or under a covered area with basketball hoops and such right outside of it. There were two "portables"  (classrooms outside the main school that were built so the school could accommodate more students) that had recently been built outside the school by the gym, and these were on the cusp of being flooded due to a storm drain that had stopped functioning near them. The day afterwards, my mom, my brother and I went on an expedition to find some remaining puddles and came across a small lake in an area near the arboretum that had poor drainage. A couple days later, I went fishing with my dad in Puget Sound and saw logs deposited by the outflow of the region's rivers scattered outside the Edmonds marina.

I also remember one of the heaviest downbursts of rain ever recorded in Seattle. It was around 4:40 p.m. on Thursday, December 14, 2006 when I began to hear a long, consistent roar outside. I went out to check and witnessed the heaviest rainfall rates I had ever seen in my life. The ground was saturated from the previous November, which was the wettest month on record for many places (including Seattle), and several inches that had fallen since Monday. The ground could not absorb any more water, so the rain from this brief squall turned roads into rivers and even tragically drowned a woman living in Madison Valley, a bowl-shaped region that was among the hardest hit by the storm. My very primitive Lacrosse rain gauge measured rainfall rates of 1.88 inches per hour, and they likely reached over 2 inches per hour for brief periods of time. Those two events stick out very clearly in my mind, and by combining the massive amount of rainfall on the 20th with the massive rates on the 14th, I am able to gain an inkling of perspective on the biblical amounts of rain received in Boulder on the 20th.

Between the afternoon of Monday, September 9 and Friday, September 13, much of the Front Range of Colorado saw unprecedented amounts of rain and associated flash flooding. Boulder was one of the areas hardest hit, receiving 14.62 inches during this time period with 9.08 inches on Thursday, September 12 alone. To make matters even flash-floodier, most of this rain occurred in a couple hours. The previous record for total daily rainfall in Boulder, an impressive 4.80 inches on July 31, 2013, was nearly doubled.

And on that note, I'm hitting the hay. It is 5:59 a.m., and I've done a little storytelling and a lot of research that will hopefully make the rest of this post go a little quicker. I'm not Bible-sleepy, but I'm a fair bit more relaxed. ;)
__________________________________________________________

Alright. It is 10 hours and 22 minutes later, and I'm ready to write again. I just got back from a strenuous workout, but I'm not quite tired enough to begin my ritualistic afternoon nap. Thankfully, I got the two B's... Blogger and Bible, and I'll choose the former.

One note on the pictures below... most of this content was taken from other people's blogs on the Colorado floods. The pictures below are in the public domain, but I still give credit to the people from which I got the pictures from. I'm adept at obtaining pictures of any sort to describe Pacific Northwest weather because I do it all the time, but I'm simply not familiar with places to get the types of charts and imagery that are shown below.

Now that that's out of the way, let's take a look at how it all started.

We had a setup here that was actually pretty darn similar to a setup that brought intense rains to Alberta earlier this summer. The 500 millibar height chart below shows the configuration of the atmosphere on June 20, 2013 at the height of the event. High pressure in northern Alberta prevented a low-pressure system from passing eastward across the country, and since air flows into areas of low pressure, warm, humid air with origins east of the Rockies flowed westward and produced incredible amounts of orographic precipitation as it encountered the topography of the Rockies.

NWS Upper level analysis of the weather pattern leading to Alberta flooding as of 5 a.m. PDT, Thu 20 Jun 2013. Retrieved from TheWeatherNetwork.com. Chart URL: http://www.theweathernetwork.com/news/articles/colorado-flooding-echoes-of-alberta-/12914/

Now, fast-forward three months and you have a very similar scenario setting up further south along the eastern edge of the Rockies.

NWS Upper level analysis of the weather pattern leading to Colorado flooding as of 5 a.m. PDT, Thu 12 Sep 2013. Retrieved from TheWeatherNetwork.com. Chart URL: http://www.theweathernetwork.com/news/articles/colorado-flooding-echoes-of-alberta-/12914/

Again, you've got a moist, slow-moving low pressure system to the west that has its eastward progress slowed by a large area of high pressure over Canada. It's essentially the same pattern shifted to the south. Again, this low was responsible for steering air east of the Rockies, in this case directly from the Gulf of Mexico, northwestward into Colorado. This event occurred around the annual peak of sea-surface-temperatures in the Gulf of Mexico, and the air directed into the area had incredible amounts of moisture and heat energy within it. When that air collided into the Front Range, well, you know the rest.

The chart below shows balloon soundings from the Denver area around the time of the big floods. It shows a lot of things, and all are very useful in their own special ways. I want to you take a particularly close look at two things, though. The first is the total Precipitable Water (PW) value, which is located on the bottom left of the chart under "Parcel." These values are a measure of how much moisture in the atmosphere. More specifically, they measure how much water would precipitate (fall towards the ground) if all the water vapor in a column of the atmosphere was condensed. Since this value is 1.15 inches, the water vapor alone within the column of air sampled by the balloon would amount to 1.15 inches of rain. That's a LOT of moisture. Additionally, the level of moisture was extremely deep. The red and green lines represent the temperature and dew point, respectively, throughout the atmosphere. They are essentially the same all the way up to the 500mb level, which is approximately 18,000 feet in the atmosphere. That's INSANE. 

The top three highest PW values ever recorded in September at Denver since records began in 1948 occurred over the 12-13th, and they completely overshadowed anything that had ever been seen before.

1.33" 12Z September 12, 2013
1.31" 00Z September 12, 2013
1.24" 12Z September 13, 2013
1.23" 12Z September 10, 1980
1.22" 00Z September 2, 1997
1.21" 00Z September 7, 2002
1.20" 00Z September 13, 2013
But how can we have PW values of "only" 1.3 inches but still end up with 10 inches of rain in spots? Remember, this moist air was constantly pouring into the area, so as water vapor condensed out of the atmosphere and the atmosphere held less, this relatively drier air was continuously replaced by moister air originating from the Gulf.

The second one is the environmental lapse rates. These are located below the PW value, and represent the rate at which the air temperature changes with height (positive values correspond to decreasing temperature with increasing elevation). Environmental lapse rates change, but there are two lapse rates commonly used in meteorology that are always the same. These are the unsaturated and saturated adiabatic lapse rates and represent the laboratory-tested values of the rate of change of air temperature a parcel experiences as it rises (or decreases) in elevation.


The unsaturated adiabatic lapse rate in our atmosphere has been found to be a cooling of 9.8 degrees C per km gained in the atmosphere. The saturated one varies strongly with temperature, but it is usually around 5.5 degrees C per km. If you want to calculate it more specifically, follow the equation below...

\Gamma_w = g\, \frac{1 + \dfrac{H_v\, r}{R_{sd}\, T}}{c_{p d} + \dfrac{H_v^2\, r}{R_{sw}\, T^2}}= g\, \frac{1 + \dfrac{H_v\, r}{R_{sd}\, T}}{c_{p d} + \dfrac{H_v^2\, r\, \epsilon}{R_{sd}\, T^2}}

... where

\Gamma_w = Wet adiabatic lapse rate, K/m
g = Earth's gravitational acceleration = 9.8076 m/s2
H_v = Heat of vaporization of water, = 2260000 J/kg
r = The ratio of the mass of water vapor to the mass of dry air, =.6219897 kg/kg
R = The universal gas constant = 8,314 J mol−1 K−1
M = The molecular weight of any specific gas, kg/kmol = 28.9635 for dry air and 18.015 for water vapor
R/M = The specific gas constant of a gas, denoted as R_s
R_{sd} = Specific gas constant of dry air = 287 J kg−1 K−1
R_{sw} = Specific gas constant of water vapor = 462 J kg−1 K−1
\epsilon=\frac{R_{sd}}{R_{sw}} =The dimensionless ratio of the specific gas constant of dry air to the specific gas constant for water vapor = 0.6220
T = Temperature of the saturated air, K
c_{pd} = The specific heat of dry air at constant pressure, = 1003.5 J kg−1 K−1

______________________________________________________________

Sorry, just needed to put that in there. It's actually pretty easy to calculate... the only variable is the temperature of the saturated air. The rest of the letters represent constants. That said, it doesn't look fun. I got it from Wikipedia, which means it's 100% right.

Anyway, the unsaturated adiabatic lapse rate is always less than the unsaturated lapse rate because the condensation of water droplets from water vapor is an exothermic process - that is, it releases heat. Since there was SOOO much moisture in the atmosphere and moist lapse rate was lower than the environmental lapse rate, the air that rose cooled at a slower rate than the air around it, causing it to rise even further because it was less dense. The combination of a large change in temperature with height and copious amounts of moisture can be a recipe for disaster, and when you factor in the orographic effects of the mountains providing additional lift, you have a recipe for an apocalypse.

Below are two pictures that I thought were particularly apocalyptic. I got them both from Jeff Masters' Wunderblog from Weather Underground.

Flooding in Boulder, Colorado on Wednesday evening, September 11, 2013. Photo posted by brandish on Instagram @photogjake.

Damage to Highway 34 along the Big Thompson River, on the road to Estes Park, Colorado. Image credit: Colorado National Guard.

Here's a doppler radar estimate of the totals from just the 12th that I retrieved from Jeff Masters' Wunderblog. There's a small location of over 12 inches to the south of Boulder. Some places received over 20 inches from the entire event.


And here is a "recurrence interval." Have you ever heard the term "100-year-flood"? Well, it looks like this event was closer to the 1-in-1,000 year category in some places, meaning it has a 0.1 % chance of occurring any specific year.

I used Luke Madaus' Looking Aloft blog, an article written by The Weather Network, and, as mentioned before, Jeff Masters' Wunderblog as my primary sources of information to write this blog. You should definitely follow Luke's blog... he's a UW atmospheric sciences graduate student who was a TA in the 101 class I took with Cliff Mass fall quarter freshman year. He knows his stuff AND is a really good writer. He, along with Scott Sistek and Cliff Mass, are "there" as far as blogging goes. I'm currently "here," but I'm working on getting over "there."
We have a wet weekend ahead of us, but I doubt we'll be seeing any Bible references in NWS forecast discussions. :)


Charlie

Tuesday, September 17, 2013

Farewell, Mister Summer

Tuesday, September 17, 2013
5:26 p.m.


The last (days of) summer. Source: Wikimedia Commons. Picture URL: http://en.wikipedia.org/wiki/File:Leonardo_da_Vinci_-_Ultima_cena_-_ca_1975.jpg

From an astronomical, meteorological, and metaphorical point-of-view, His last meal is Friday night. Granted, Summer isn't quite emanating brilliance like Mr. Christ in Leo's little sketch, but just like Christ, He doesn't have that much longer to live. I'll see if I can reserve a spot in the Seattle Times for an obituary on Sunday.

Last week, summer was alive and well. This week, it is on its deathbed. Some are in denial, but most realize that the summer of 2013 will forever pass away. Now is the time for those who love summer to say their goodbyes. Proles throughout the Pacific Northwest will likely be sobbing a-plenty on Saturday as temperature drops into the mid 60s and rain arrives, but they will need to take their ceremonies inside on Sunday as fall truly shows that it's here to stay for a whole three months. While it is true that we have seen some dreary days this summer, we've always rebounded to a warm and sunny pattern with the occasional (or in some cases, more-than-occasional) summer thunderstorm. And while there is a chance that we may experience some brief, temporary summer reincarnations during October, our days of sizzling summer sun are over.

Even though summer is on its deathbed, it still has a pulse. It may be slow and irregular, but it's still there. Take a look at the current 500-millibar height chart below.

Valid 05:00 am PDT, Tue 17 Sep 2013: Absolute vorticity, 500mb heights (meters). UW WRF-GFS 36km Resolution: Initialized 12z Tue 17 Sep 2013. Retrieved from the (University of Washington) Pacific Northwest Environmental Forecasts and Observations website. Chart URL: http://www.atmos.washington.edu/~ovens/wxloop.cgi?mm5d1_x_500vor+///3.

As you can see, we've got zonal flow from the northwest and a small trough over our area. It is 6:15 p.m. as I write this sentence, so the axis of the trough to the west of Seattle in the above picture is probably over the Cascades now. A setup like this with a cool, northwesterly jet is commonplace for autumn, and I would say that summer's pulse had officially _______________'ed if it wasn't for a slight warming over the next couple days as a ridge comes to the rescue.

Valid 11:00 pm PDT, Wed 18 Sep 2013 - 42hr Fcst: Absolute vorticity, 500mb heights (meters). UW WRF-GFS 36km Resolution: Initialized 12z Tue 17 Sep 2013. Retrieved from the (University of Washington) Pacific Northwest Environmental Forecasts and Observations website. Chart URL: http://www.atmos.washington.edu/~ovens/wxloop.cgi?mm5d1_x_500vor+///3.

Last week was definitely summer's grand finale, and all we are left with are a few undetonated mortars for summer's delinquent sons and daughters to set off. It looks as though they are currently planning to set off their explosive devises on Thursday, allowing highs to reach the mid 70s in Seattle and low 80s further south and towards the foothills. Wednesday and Friday morning are prep and clean-up days, respectively, so there might be a few showers rolling around, but they will be light and scattered in nature.

Friday afternoon is our prep day for autumn. A weak front crawling eastward will finally begin to bring some precipitation to the coast. This front isn't particularly strong, but it will act to push the ridge eastward and "open the gates" to the Pacific storm track. And that is when our summer will end.

Valid 02:00 pm PDT, Fri 20 Sep 2013 - 81hr Fcst: 3-hour precipitation (inches), 10-meter wind (knots). UW WRF-GFS 12km Resolution: Initialized 12z Tue 17 Sep 2013. Retrieved from the (University of Washington) Pacific Northwest Environmental Forecasts and Observations website. Chart URL: http://www.atmos.washington.edu/~ovens/wxloop.cgi?mm5d2_x_pcp3+///3

It won't end in a super dramatic fashion, as the front will disintegrate and fall apart as it nudges the ridge eastward and gets torn up by topography, but a quick look at the same 500-millibar chart on Saturday clearly shows that summer is out and autumn is in.

Valid 02:00 pm PDT, Sat 21 Sep 2013 - 105hr Fcst: Absolute vorticity, 500mb heights (meters). UW WRF-GFS 36km Resolution: Initialized 12z Tue 17 Sep 2013. Retrieved from the (University of Washington) Pacific Northwest Environmental Forecasts and Observations website. Chart URL: http://www.atmos.washington.edu/~ovens/wxloop.cgi?mm5d1_x_500vor+///3.

The ridge is no more, and a solid storm is slithering southeast on a track to terrorize the metropolis. And by Sunday evening, all hope is lost.

Valid 05:00 pm PDT, Sun 22 Sep 2013 - 132hr Fcst: Absolute vorticity, 500mb heights (meters). UW WRF-GFS 36km Resolution: Initialized 12z Tue 17 Sep 2013. Retrieved from the (University of Washington) Pacific Northwest Environmental Forecasts and Observations website. Chart URL: http://www.atmos.washington.edu/~ovens/wxloop.cgi?mm5d1_x_500vor+///3.

Valid 05:00 pm PDT, Sun 22 Sep 2013 - 132hr Fcst: 3-hour precipitation (inches), 10-meter wind (knots). UW WRF-GFS 12km Resolution: Initialized 12z Tue 17 Sep 2013. Retrieved from the (University of Washington) Pacific Northwest Environmental Forecasts and Observations website. Chart URL: http://www.atmos.washington.edu/~ovens/wxloop.cgi?mm5d2_x_pcp3+///3

On that note, uh, have a good one folks.

Charlie :)

Sunday, September 15, 2013

The Seahawks/49ers Game!

Sunday, September 15, 2013
1:11 p.m.

The battle in Seattle. Retrieved from PricePerHead.com. Image URL: http://news.priceperhead.com/wp-content/uploads/2012/10/49ers-vs-seahawks.jpg

First off, let me apologize for my hiatus in blog posts. I've finally settled down into my new place, and I love it. My roommates are spectacularly good people, and I'm having a ball here. I've still got a little organizing to do yet, but I'm getting close. School starts in ten days though, and I'm definitely not ready for that.

Today will feature one of the biggest games of the entire 2013 NFL season - a brawl between the 49ers and Seahawks at Quest Field. I can't remember a regular-season game in which the stakes have been higher. These teams are arguably the two best in the NFL, and they are in the same division. And Kaepernick and Wilson are two of the best quarterbacks in the game today. If you plan to ask any favors of me today, do so after the game. I'll even stay glued to the screen during commercials so that I have no chance of missing any football action.

One of the many things I love about football is that it is played in all kinds of weather. There are none of those wimpy "rain-outs" like they have in baseball. Of course, stopping a baseball game if moisture arrives is generally a good idea considering that the vast majority of the game is dependent on how the hitter reacts to a 90 mph fastball inches from his body, so there is that factor. I can only recall a football game being stopped due to weather once, and that was during a Thursday night game at Quest Field on December 14, 2006 as a rain band of record-breaking intensity swept through the area and flooded the field.

I may be regarded as a weather god among some of my friends who've been graced by my providential snowfall forecasts, but the truth is that I honestly pretty illiterate when it comes to technical meteorological language. The NWS forecast discussion this afternoon was pretty hard for me to comprehend, but here's what I gathered. We've got a low pressure center in the upper levels of the troposphere approaching the Oregon coast right now, and the flow to the north of the circulation into Western Washington is unstable (large change in temperature with height) and diffluent (air diverges, making it easier for less dense air near the surface to rise and create convective showers). We've got a stubborn marine layer from a big onshore push last night that hasn't gone away, so surface heating won't be much of a factor. However, as the evening goes on, the layer will break down as instability increases. As the upper-level low becomes closer, a "vorticity maximum" - the center of a vorticity field - will go through the area, providing additional lift and instability. As the vorticity values decrease, the atmosphere will stabilize, and showers will come to an end. "Vorticity" refers to the tendency of an air parcel to spin and is the adjective form of "vortex."

Taken 3:23 pm Sun 15 Sep 2013. UW Northwest Radar Loop. Loop URL: http://www.atmos.washington.edu/weather/radar.shtml

The radar picture above shows a line of showers poised to strike the Seattle area and continue northward through Western Washington. There are some even heavier showers offshore... some containing lightning and hail. These showers are moving north. The shower activity currently comes to an end to the south of a NW-SE line band of showers, so it would seem as though our shower activity would end soon. The NWS is calling for additional showers this evening though, and who am I to claim superiority over people who do this stuff for a living?

Regardless, there is nothing I'd love to see more than Kaepernick get sacked by a sudden gust of wind with one of these storms. Go Hawks!

~Charlie

Thursday, September 5, 2013

First Big Storm of the Season

Wednesday, September 4, 2013
8:49 p.m.

A fake image of Hurricane Sandy supposedly eying the Statue of Liberty that went viral on Twitter back in October of 2012.

I remember when the above picture went viral all over the internet last year. I took one look at it and knew that it was fake; the cloud in the back is a LP (low-precipitation) supercell thunderstorm, and New York was not in an atmospheric configuration that would allow a storm like this to form. This storm was actually over Nebraska, which commonly receives supercell storms as it is located in "Tornado Alley" over the Great Plains of the United States.

We won't see anything remotely close to Hurricane Sandy over our neck of the woods, but we will see the first organized storm system we have seen in a long, long time. We saw those intense thunderstorms on the 29th over the area that brought quite a bit of rain to parts of the area, but as the Seattle RainWatch picture below shows, far more rain fell in some locales than others. Renton got pounded with nearly two inches, with most of this rain occurring in one hour. My house in Seattle picked up a measly 0.1 - 0.2 inches of rain. 0.1 to 0.2 inches of rain per hour is actually pretty heavy rain by Seattle standards, but two inches of rain is extreme and something that is hardly ever seen here.

I got the below picture from Cliff Mass' blog. I went to the Seattle RainWatch website to try and get the picture myself, but I couldn't find past data older than 48 hours. 

Valid 04:47 p.m. PDT, Fri 30 Aug 2013 - Previous 24-Hour Precipitation. Retrieved from Cliff Mass' Weather Blog

We had a similar type of situation a couple nights back. Take a look at the chart below. 3+ inches southwest of the Kitsap Peninsula, with much less on the peninsula itself. Southern Seattle hardly got anything.

I retrieved this from the actual Seattle Public Utilities Rainwatch Website myself.

Se
Valid 8:51 p.m. PDT, Tue 4 Sept 2013 - Previous 48-Hour Precipitation. Retrieved from Seattle Public Utilities RainWatch website.

Today, we will see some thunderstorms, and the Seattle RainWatch pics will probably look similar to the ones above. If you look at the model below, you can see that there is not really a uniform band of precipitation over a large area. Instead, you have these convective showers that pop up everywhere. These are not being marked as terribly strong in this chart, but I believe that some could be. We've made a lot of progress with numerical weather prediction, but we aren't at the point where we can consistently predict individual convective showers.

Valid 02:00 pm PDT, Thu 05 Sep 2013 - 21hr Fcst: Total Precipitation in Past Three Hours, (bottom numbers are in units of 0.01 inch) Wind at 10m (knots). UW WRF-GFS 4km Resolution: Initialized 00z Thu 5 Sept 2013. Retrieved from the (University of Washington) Pacific Northwest Environmental Observations and Forecasts website.

My belief that some may be quite strong is due to the CAPE (Convective Available Potential Energy) over our area at the same time.

Valid 02:00 pm PDT, Thu 05 Sep 2013 - 21hr Fcst: Maximum CAPE (J/Kg), SLP (hPa). UW WRF-GFS 12km Resolution: Initialized 00z Thu 5 Sept 2013. Retrieved from the (University of Washington) Pacific Northwest Environmental Observations and Forecasts website.

CAPE is essentially a measure of how buoyant a parcel of air is and, by extension, the overall instability of the atmosphere. We usually do not see CAPE values this high over Western Washington. We've also got quite a bit of moisture in the air, so this unstable, rising air will have the opportunity to condense and form cumulus clouds which may later become cumulonimbus. If these showers are as intense as last time, certain areas could pick up extreme amounts of rain in a short period of time while nearby areas stay dry.

But unlike the previous events shown by the RainWatch charts above, Western Washington (and much of the Pacific Northwest for that matter) will see steady, heavy, November-esque rain later tonight into Friday as a deformation zone sets up over the area. A deformation zone is an area where a mass with fluid characteristics is stretched and sheared due to variations in wind. This stretching of the air mass aloft creates a vacuum of sorts, causing air from the surface to rise in an attempt to equalize the pressure differences. This rising of air causes clouds and precipitation. The picture below shows how air converging in one place often results in it diverging from another place.

Deformation Band Schematic. Author: COMET Program. Retrieved from NWS Central Region Headquarters.

Even though the air rises to create clouds and precipitation, deformation bands/zones actually tend to form in a pretty stable atmosphere. Take a look at the CAPE over our area.

Valid 11:00 pm PDT, Thu 05 Sep 2013 - 30hr Fcst: Maximum CAPE (J/Kg), SLP (hPa). UW WRF-GFS 12km Resolution: Initialized 00z Thu 5 Sept 2013. Retrieved from the (University of Washington) Pacific Northwest Environmental Observations and Forecasts website.

Much lower CAPE over the state, but as the picture below shows, much higher precipitation where the deformation band is.

Valid 11:00 pm PDT, Thu 05 Sep 2013 - 30hr Fcst: Total Precipitation in Past Three Hours, (bottom numbers are in units of 0.01 inch) Wind at 10m (knots). UW WRF-GFS 4km Resolution: Initialized 00z Thu 5 Sept 2013. Retrieved from the (University of Washington) Pacific Northwest Environmental Observations and Forecasts website.

This precipitation will be more stratiform in nature, and because the CAPE is low and the atmosphere isn't too unstable, we will not see thunderstorms associated with the band.

The band will sweep over Seattle early Friday morning. When it is all said and done, Seattle will probably have around an inch of rain, and certain spots in the Cascades could reach 4+ inches. Storm totals could be highly variable based on the nature of the showers and thunderstorms today, but once we enter the nighttime hours, much of the state will get smacked.

Valid 05:00 pm PDT, Fri 06 Sep 2013 - 48hr Fcst: Total Precipitation in Past 24 Hours, (bottom numbers are in units of 0.01 inch) Wind at 10m (knots). UW WRF-GFS 4km Resolution: Initialized 00z Thu 5 Sept 2013. Retrieved from the (University of Washington) Pacific Northwest Environmental Observations and Forecasts website.

Deformation bands can be pretty hard to accurately predict, so the rainfall totals shown above should be taken with a grain of salt. One thing looks to be certain though: after some showers today, some of which could be quite intense, some part of the state will get a good soaking.

We will return to a sunny pattern after this low pressure system moves on through. By next week, you'll probably forget that this storm ever happened.

Still, when was the last time you saw this?

Watches and Warnings over Western Washington. Retrieved from NWS Seattle website.

Have fun!

Charlie

Monday, September 2, 2013

A Record Heat Wave, but only for Minimums

Thursday, August 29, 2013
2:16 p.m.

Alright, I have to give credit where credit is due. Both Scott Sistek and Cliff Mass, my two favorite weather bloggers in the Pacific Northwest, blogged here and here about how we have seen record nighttime/early morning warmth as of late. These blogs are far better than mine... I suggest you read them. Not necessarily in place of my blog, but, if you really want to learn about the weather of the Pacific Northwest, their blogs are the place on the web to visit.

Now, I know that the phrase "record warmth" may seem a little out to left field for most of you. That's because we are not talking about record maximum temperatures, but because we are talking about record high minimum temperatures. They are the little brother of the record highs we all know and love, and as such, they are often overshadowed by their elder's achievements. But we have been warm at night as of late. I have to admit that, while I did know that our minimums were higher than normal, I had no idea of the magnitude of the departure from average until I took a peek at the aforementioned blogs, and it was probably because I'm still quite familiar with the Micronesia minimums, where you would be jumping for joy if the temperature plunged to 75 and the dew point to 70 because you knew that a restful night of sleep was just around the corner. Let's take a look at the statistics from the past month and see our recorded temperatures versus the averages for this time of year.

The three plots below show the recorded temperatures as compared to the average temperatures for the past 12 weeks. This minimum heat wave is occurring throughout the state. I don't have access to the charts for other Oregon, but you can bet your bottom that it'd look pretty darn similar.

Plots comparing recent data to extremes and averages. SeaTac Airport: Temperatures Over the Last 12 Weeks (GMT). Retrieved from (University of Washington) Live From Earth and Mars - GRAYSKIES - Pacific Northwest Weather Resource website.
Plots comparing recent data to extremes and averages. Walla Walla: Temperatures Over the Last 12 Weeks (GMT). Retrieved from (University of Washington) Live From Earth and Mars - GRAYSKIES - Pacific Northwest Weather Resource website.
Plots comparing recent data to extremes and averages. Quillayute: Temperatures Over the Last 12 Weeks (GMT). Retrieved from (University of Washington) Live From Earth and Mars - GRAYSKIES - Pacific Northwest Weather Resource website.

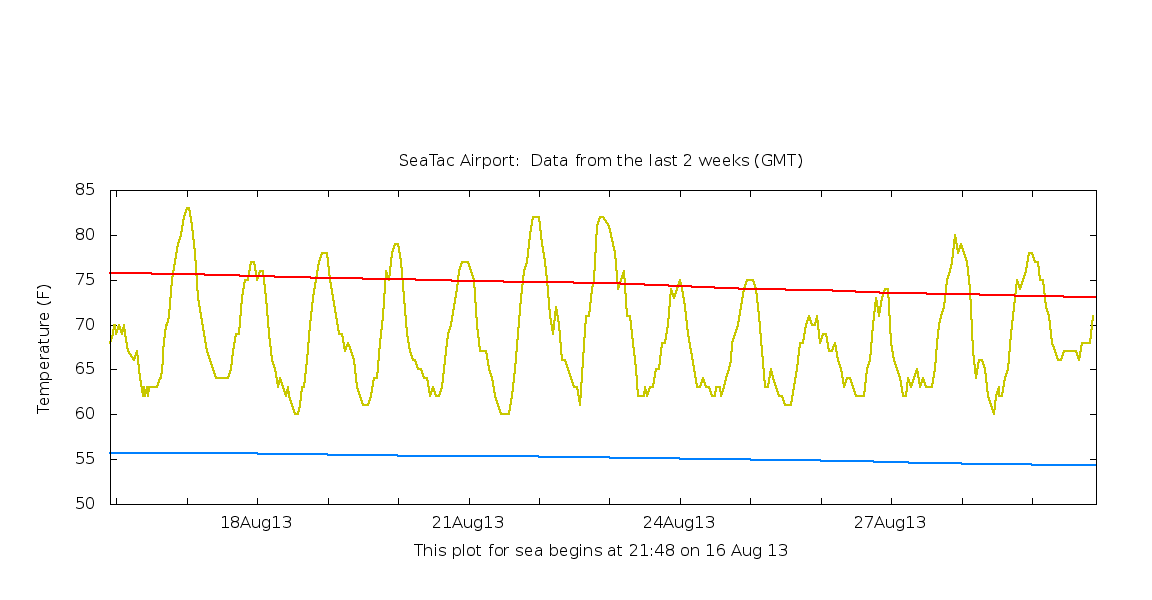
Just to drive the point home on how consistently warm it has been, take a look as the 2-week chart from Sea-Tac below. It uses the same data as the 12-week chart, but it is zoomed in for optimal viewing convenience.

Plots comparing recent data to extremes and averages. SeaTac Airport: Temperatures Over the Last 2 Weeks (GMT). Retrieved from (University of Washington) Live From Earth and Mars - GRAYSKIES - Pacific Northwest Weather Resource website.
I can't ever recall something like this occurring, and neither can anybody else, so if you claim that you can, you're lying. Let's take a look at why this has been happening.

Valid 05:00 pm PDT, Sun 01 Sep 2013: 925 mb Temperature, Heights, and Winds. UW WRF-GFS 12km Resolution: Initialized 00z Sun 2 Sept 2013. Retrieved from the (University of Washington) Pacific Northwest Environmental Forecasts and Observations website

Usually, our winds aloft are northerly, but as you can see in the chart above, they are currently southerly. When we get southerly winds, we get higher dew points (the dew points over the ocean are actually quite low because the water is so cold). Water vapor is a greenhouse gas, which means it is very good at absorbing and emitting infrared radiation, and not all of this infrared radiation is reflected back out to space. Therefore, there is a net "insulating" effect from the high dew points. And these high dew points have also been responsible for the amazing thunderstorms we have seen this summer, most recently in early-mid August for Western Washington. Although we haven't been seeing intense electrical storms 24/7, we have been in a pattern similar to the one shown above for much of the summer, with southerly winds aloft bringing increased dew points into the area. Additionally, we have not had the classic "marine pushes" that we usually see to cool us down because east-west pressure differences have been small due adjacent high pressures over the inland Pacific Northwest and off the West Coast.

The picture below is from the NWS Seattle office and shows the monthly temperature and rainfall statistics compared to average. As you can see, the average low was either the warmest or second warmest on record for every place except Hoquiam.


The previous record at Sea-Tac was 58.4 degrees back in '67. I think it's safe to say we annihilated that record. Measurements used to be taken at the Federal Building downtown, and the record there was 59.1 degrees in July 1941. Credit to Scott Sistek for providing that statistics, which I would certainly spent hours trying to find myself.

Minimums still look below average for the coming week, but not extraordinarily so, and dew points will not get above 60. I suspect this is welcome news for most people. As for me... I've hardly noticed the humidity. Micronesia may have given me humidity discomfort immunity for life.

Thanks for reading!!!
Charlie

Ended Monday, September 2, 2013
1:03 a.m.