Thursday, October 31, 2013

ATMOS 301: Dry Adiabatic Processes

Thursday, October 31, 2013
8:37 p.m.

An adiabatic process is a process in which a material undergoes a change in its physical state without releasing or extracting any heat from the atmosphere. In other words, dq = 0 in the equation below, where dq = change in thermal energy (this is the first law of thermodynamics, check out my previous post for more info on it).


Because of our hydrostatic balance equation,


, and since we've let dq equal 0, we can get the following equation after substitution.


The equation below shows that the temperature decreases 9.8 degrees Celsius or Kelvin (your pick) per kilometer when it is raised at constant pressure without any moisture being released. It inreases at the same rate when it decreases at constant pressure. For a more generalized equation to show what the temperature will be like at any point when risen to a certain height with this process, use the equation below.


But what about using it in terms of pressure?

Well, you substitute from the equation of state, it's a lot uglier to calculate, and in the interest of time (it's now 8:57 p.m. Thursday night), I'm not going to do the proof. I doubt we will have to write it out on a 50 minute test. I think the main thing to take away from using it in terms of pressure is that it is more exact than z-coordinate calculation because you are not assuming the parcel is hydrostatic.


Potential Temperature: (because virtual temperature wasn't good enough)

The potential temperature θ is the temperature of a parcel of air after being brought dry-adiabatically (the process I just described above) to the 1000 mb level. If we know the temperature and pressure of an air parcel, then we know the potential temperature. Here's the relationship between temperature and pressure if we let K = R_d/c_p =~ 0.286.

T_2 = T_1(p_2/p_1)^K

And here's the more specific equation for potential temperature.

θ = T(1000mb/p)^K

If we take the derivative of θ... i.e., find out its rate of change, we get the equation below, which, just like every other equation in this god-forsaken pdf on thermodynamics, is atrociously ugly. The thing that matters is the term on the far right, though. dθ = 0. How nice. This means that the potential temperature is conserved and does not change as a function of height (provided that it doesn't exchange any heat with its environment) This is not true for the actual temperature that is measured by thermometers.


Cool. Now let's add water vapor to the equation. ;)

Charlie

ATMOS 301: The First Law of Thermodynamics

Thursday, October 31, 2013
5:54 p.m.

Our third law that we will concern ourselves with is the first law of thermodynamics. It will be the third of the "big six" we will look at for now. Here's the law.


This law says that the heat added to a certain mass of a gas is equal to its change in internal energy + the work done BY the gas ON the environment.

A classic example of the first law of thermodynamics at work is the piston. In order to make the piston system move, we first need to add heat to it. All or some of this heat Q is used to increase the internal energy of m. The rest of this heat is used to move the piston upwards.

In order to move a piston up, we need to do work on it. To push the piston outward through an external force dx, we set up the following equation, where dW equals the derivative of work and dx equals the derivative of x. For those of you who don't know calculus, derivative means "rate of change."

dW = Fdx

In the case of the piston, we have a cross-sectional area A exposed, so because F=p*A, we plug that in to get dW=p*A*dx = p*dV. Our final equation, dW = p*dV, says that the work done by the substance when its volume increases by a small increment dV is equal to the pressure of the substance multiplied by its increase in volume. If you want to find the total work done, just take the integral from V_1 to V_2.
__________________________________________________________________

I thought that was pretty easy to understand. Then we started getting into some other proofs that looked quite ugly.

Just to review:
 
Work = F*d (force*distance) = ρ*ΔV (density*change in volume)
Volume=A*L(area*length)
α = V/m (volume/mass)


Below are some variations on the ideal gas law. C_v is equal to the specific heat of vapor (water vapor), which is the amount of heat per unit mass required to raise the temperature by one degree Celsius. dq is the change in thermal energy, dT is the change in temperature, dα is the change in specific volume (1/density), and dp is the change in pressure.


We didn't spend a ton of time talking about the first law of thermodynamics, but we did spend a great deal talking about adiabatic processes. Without further ado, let's move on to some of those.

Charlie

ATMOS 301: The Hydrostatic Equation

Thursday, October 31, 2013
3:20 a.m.


I got a lot of sleep today, OK? So I'm allowed to do this. Plus, I don't have class until 1:30 tomorrow.

You ever feel your ears pop in an airplane? That's because you are going into the upper levels of the atmosphere where the pressure is lower. Remember, pressure is equal to force/area, and force is equal to mass*acceleration. When we increase in elevation, all that mass of the atmosphere that was previously weighing down on us is now below us, and the pressure on us is therefore lower. When we undergo this change in elevation and babies of all shapes and sizes begin to cry, we are directly experiencing the effects of the pressure gradient force. And, of course, as I'm sure all of you know, airplanes, while not counteracting the effects of gravity, keep us afloat at 35,000 feet so we can travel from point A to point B. These two forces - the pressure gradient force and the gravitational force - play a huge role in what is called hydrostatic equilibrium.

The gravitational force pulls objects towards the center of the Earth, so theoretically, it should pull all the atmosphere down to the ground. However, the pressure gradient force causes air to flow from high pressure to low pressure, so according to it, the atmosphere should have a homogeneous pressure distribution. So why don't we see either of those outcomes? Well, that's where the hydrostatic equilibrium comes into play.

Here are the individual forces that contribute to hydrostatic equilibrium.

g = gravity (9.8 m/s^2)
ρ = density
A = area
p = pressure
Δ = change in (insert variable here)

Gravitational force downward: g*ρ*A*Δz
Pressure force downward: (p + Δp)*A
Pressure force upward = p*A

Ok, it's now 4:49 a.m. I should sleep. Goodnight.

Alright, 11:45 a.m. and back to work. I have class at 1:30. I'd like to take a shower and eat before then as well. I hope you realize how epic this will be if I get all this done.

Anyway, we were talking about the hydrostatic equilibrium and why the atmosphere is structured the way it is. Since we have these forces that work in opposite directions, they get to a point where they equalize and the general structure of the atmosphere doesn't change. The equation for this is given by:

p*A =  (p + Δp)*A + g*ρ*A*Δz

This equation shows the pressure force upward having an equal magnitude to the sum of the pressure force above the specified level of air downward and the gravitational force downward. We can also restate this as:

Δp/Δz = -ρ*g

And by taking limits and partial derivatives, we end up with our final hydrostatic equation that we all use... an equation so important that it deserves its own picture.


Geopotential Height:

I know what you're thinking. These terms aren't getting any easier to understand. I'm right there with you. Although, I have to admit, I've always seen this term thrown around on the UW mm5/WRF model charts, and I've always wondered what it was but for some reason or another never actually tried to figure it out. Well, now that I have a midterm in 25 hours and 20 minutes, I'm suddenly a lot more interested in it. Imagine that!

The geopotential Φ at any point in the Earth's atmosphere is defined as the work that must be performed to raise 1kg of something to that point. The units are J/kg or m^2/s^2, suggesting that Φ is the gravitational potential per unit mass. The force (in newtons) acting on 1 kg at a given height z above sea level is the same as g, as g is, for our purposes, constant with altitude. The work is given by the integral of gdz from 0 to z, where z is equivalent to the height. The resulting work ends up just being equal to gravitational acceleration (9.81 meters/second^2) multiplied by the height the parcel is lifted. The equation below is just basic calculus.


The Hypsometric Equation:

Would you like fries with that?

Everybody loves a combo. And that's exactly what the hypsometric equation is. It's a conglomerate of our equation of state and our hydrostatic equation. Remember, the equation of state is P=ρR_dT_v and the hydrostatic equation is ∂p/∂z = -ρ*g. Now watch what we do here when we combine the equations. To make things easier to read, I'm just going to take a snapshot of Professor Houze's slide instead of trying to make a bunch of ugly subscripts and fractions.


 Once you have dZ = (R_d/g_o)*T_v*d*ln(p), you take the integral of both sides and you get the hypsometric equation below. For those of you taking the test, I would highly recommend memorizing the equation and what each of the variables mean. It showed up on one of the quizzes and I couldn't remember it, so I tried to try and BS it by using the hydrostatic equation, which is much simpler. It didn't really work, but I managed to scrape a few points. :)


The Scale Height:

In atmospheric science, the scale height is the distance over which a substance decreases by a factor of e (2.71828... the base of natural logarithms). Because the atmosphere is well-mixed below the turbopause (about 105 km), the pressures and densities of individual gases decrease at about the same rate as a function of altitude with a scale height directly proportional to their gas constant R. Since R* is just a universal constant and the only thing that results in R being different for different gases is the apparent molecular weight of the mixture in the denominator, the scale height is inversely proportional to the apparent molecular weight. The average temperature of the troposphere and stratosphere is around -18 degrees Celsius (255 degrees Kelvin), and this gives us a scale height of around 8 km.

To be honest, we took some notes on this in class but I barely understood any of it, and our book only barely touches on it and we don't have any lecture notes on it. So hopefully it won't be on the midterm. If you are interested in researching it by yourself, by all means, go ahead, especially if you can get it done by the morning of November 1, 2013.

Thicknesses and Heights:

Many things in atmospheric science intersect. Fronts intersect. Winds intersect. In our neck of the woods, the Puget Sound Convergence Zone is a classic example of winds intersect. But pressure ALWAYS decreases with height, and because of that, pressure surfaces (imaginary surfaces on which pressure is constant) never intersect.


If we take a look back at our hypsometric equation, check out the term on the left. This difference in height represents the thickness of the atmosphere (usually in decameters) from one pressure level to another. The thickness of the atmosphere is determined by the temperature. Remember, a cold atmosphere is more dense, so the thickness between the different pressure levels will be more compact than it would if the atmosphere was warmer. I feel like the diagram below shows this well.


Here are some common manifestations of this effect that we see in storm systems. Mid-latitude storms (cold-core cyclones) have low heights associated with them because, as the name suggests, the air at their core is cold and therefore more dense. The opposite is true with tropical cyclones, which have very high heights.


All these diagrams, with the exception of Thumper, the Super Cool Ski Instructor, were taken from Professor Houze's lecture on thermodynamics here. Now, onto the first law of thermodynamics!


Charlie

ATMOS 301: Equation of State

Thursday, October 31, 2013
12:54 a.m.

Happy Halloween!

Happy Halloween! To our beloved Professor Houze, I'll give you a free pass on this one, but please don't schedule a midterm on April 21st.

Our professor told us there are six laws that govern the atmosphere. Today, we just finished talking about Newton's 2nd Law, which, as opposed to just being F=ma, is F = 1/(ρ)*gradient(P)*(fk X v)*av. I think. I still have to review that... today's lecture was more confusing than why Rebecca Black ever became famous. Who knows...

Anyway, the first law we went over is the equation of state law, also known as the ideal gas law. It is given by the equation below:

PV=nRT\,
, where

P = Pressure (pascals)
V = Volume (cubic meters)
n = Amount of gas (moles)
T = Temperature of gas (kelvin)
R* = Universal Gas constant (bear with me and pretend there is a star there. I got this equation off Wikipedia and it looked nice)

This can also be written as PV=mRT, where the R has no star and m = mass. The two equations are solved in different ways. This equation is often stated as P=ρRT, where ρ = mass/volume. Sometimes, it is written as Pα=RT, where α = 1/ρ = the specific volume of the gas, i.e., the volume occupied by 1 kg of the gas at pressure P and temperature T. This is the equation we are going to focus on solving.

The gas constant R of a gas is given by R*/M where R* is the universal gas constant (8.314 Joules*Kelvin−1*moles−1) and M is the molecular weight of the gas. Therefore, the gas constant varies with each gas. If you wanted to find out the gas constant of water vapor, you would divide R* by the molecular weight of a mole of water vapor, which would be 1 oxygen + 2 hydrogen = 16 + 2 = 18 grams per mole, and this = .462 Joules*Kelvin−1*gram−1). We want this in SI units, so we multiply by 1000 to turn grams into kilograms, and we get 462, which is our gas constant for water vapor (it's actually closer to 461.51, I just rounded the atomic masses of oxygen and hydrogen)! Water vapor plays a huge role in these gas laws; such a big role, in fact, that it has been given its own variable. The "vapor pressure" of water, or P in the equation of state above when it is solved for water, is commonly known as e. Therefore, eα_v=R_vT. I used the underscores to represent subscripts... all they denote is α and R for water vapor.

Since dry air is a mixture of gases, calculating R for it requires a two-step process. First, we add up the total mass of each gas the atmosphere and divide this sum by the total number of moles in the atmosphere. We then divide R* by molecular weight that is a conglomerate of all the components of air in the atmosphere to get R, which happens to be 287 J/kg for dry air. We do the same thing for moist air, but we add water vapor to the equation.

The reason why we can do this for a mixture of gases is because of Dalton's law of partial pressures, which states that the total pressure exerted by a mixture of gases that do not interact chemically is equal to the sum of the partial pressures of the gases. The partial pressure of a gas is the pressure it would exert at the same temperature as the mixture if it alone occupied all of the volume that the mixture occupies.

While we're at it, let me explain how the equation of state came to be. There were two dudes named Charles and Boyle, and they were heavily involved in the whole industry of making scientific laws that had to do with gases. Boyle discovered that if you keep your m and T constant, P is inversely proportional to V, and Charles discovered that V is directly proportional to T if you keep m and P constant AND that P is directly proportional to T if you keep m and V constant. Some smart fellow/s came around and combined Boyle's and Charles' findings into one beautiful law, and it remains one of the most fundamental laws in physics and chemistry today.

So we got Dalton, Boyle, and Charles. It's like the three musketeers.

Retrieved from http://ownbond.com/what-were-the-real-names-of-the-three-musketeers/


There's another important constant that the equation of state gives us. The ratio of the gas constant of dry air to water vapor (R_d/R_v) is equal to the ratio of the molecular weight of water vapor to dry air (M_w/M_d). This value is equal to 0.622 and is denoted by ε.
 
Virtual Temperature (because regular temperature wasn't good enough)

The equation of state is useful to derive an expression for something my textbook calls "a fictitious temperature" (Wallace & Hobbes, 2006). Sounds useless to me, but turns out it is just the opposite. The virtual temperature of a parcel of air with some moisture in it is the temperature at which a theoretical dry air parcel would have an equivalent pressure and density to the moist parcel. Because moist air is less dense than dry air at the same temperature and pressure, the virtual temperature is always greater than the actual temperature. It usually doesn't exceed it my more than a few degrees though.

Earlier, we solved for R for dry air and were able to form an equation of state suited to it. We weren't able to do that for moist air... until now. There's a long proof that shows that T_v = 1/.622*T, but the main thing to take away from the virtual temperature is that it allows for an equation of state that is always correct no matter how moist the air is. I'll give the equation its own line for ease of reading.

P=ρR_dT_v

, where

ρ = Density (kg/m^3)


R_d = Gas constant for dry air = 287 J/kg
T_v = Virtual temperature

Whew! It's 3:04 a.m. But you know what, this is an effective studying method because I feel like I have to not only study for myself but also put out some quality blogs for my friends... with a serious time deadline. Next!

Charlie

ATMOS 301: Troughs, Ridges, Waves, and Fronts

Wednesday, October 30, 2013
10:40 p.m.

It almost sounds like it could be a Dr. Seuss poem. Troughs, ridges, waves and fronts. Ditches, mountains, surfboards, and stunts.


Anyway, this will be the last of my "light duty" reviews/online lectures/blogs. The next section will be on gas laws and atmospheric thermodynamics. I'll try and write them in a manner that I can understand, and let me tell you, it won't be easy. But before I write one blog, two blog, red blog, blue blog (and possibly more), let's do some more qualitative analyses of atmospheric phenomena.

Ridges and troughs are pretty easy to conceptualize. They represent the shape of the jet stream in the upper atmosphere. In the northern hemisphere, a ridge represents a northern shift in the jet stream caused by a high pressure "pushing" it northward, whereas a trough represents a southern sagging of the jet stream caused by an area of low pressure.

The general flow of the atmosphere in the mid-latitudes in the northern hemisphere is eastward. Because these ridges and troughs travel eastward, they are often called waves. Waves come in all sorts of shapes and sizes, but for simplicity's sake, we divide them into two main categories: short waves and long waves. Generally, the shorter the wave, the faster it moves. I haven't taken any ocean physics classes, but I would like to find out if this same phenomena is true with water waves. I can't remember if/how the length of light or sound waves affects their speed when they are not in a vacuum. The picture below is another one I got from Professor Houze's presentation, and it shows the ridges and troughs quite nicely. The far right hand portion got cut off because of a formatting problem with the PDF.

Retrieved from http://www.atmos.washington.edu/~houze/301/protected/Notes/CompObsMaps.pdf

Here's an example of a 500mb chart from our latest WRF-GFS model here at the UW. Can you distinguish the shortwaves from the longwaves?


Add captValid 07:00 am PST, Tue 05 Nov 2013 - 135hr Fcst: 500mb Heights, Absolute Vorticity. UW WRF-GFS 36km Resolution: Initialized 00z 31 Oct 2013. Retrieved from the UW Pacific Northwest Environmental Forecasts and Observations Website. Model URL: http://www.atmos.washington.edu/~ovens/wxloop.cgi?mm5d1_x_500vor+///3

Remember, pressure is the vertical coordinate here, not height. Using pressure as the vertical coordinate is useful because it helps us get rid of some variable in some equation that I didn't write down. But trust me, it does in fact help get rid of some variable in some equation.

Fronts:

Many people don't know what troughs or ridges or waves are. Even I didn't have the firmest grasp of them for a long time. And I still don't think I do... I plan to study these and their effect on lower atmospheric dynamics at some point in the future over this quarter or over winter break. Whilst working with Steve Pool, we don't usually put fronts on our weather maps because he claims that much of the populace that watches the news doesn't understand what fronts are and just wants to know whether their suit should be of the swimming or survival variety. Most of my friends and family have a general idea of what they are, though.

Fronts mark the warm edge of a zone of strong temperature contrast; they are not simply the boundary between two different air masses. This horizontal temperature gradient is conducive to the formation of a low pressure system. Hopefully you all know what a low pressure system is.

Retrieved from http://www.atmos.washington.edu/~houze/301/protected/Notes/CompObsMaps.pdf

The formation of a low pressure system, known as cyclogenesis, is really complicated, and the above diagram is greatly simplified. Still, it offers a fantastic idea of the general life cycle of a cyclone.

Below is a diagram of the vertical structure of a midlatitude cyclone. The occluded front results because the cold front moves faster than the warm front, and when it does this, the warm air goes away. When I was young and studying this stuff on my own, I learned that there were two types of occlusions: warm occlusions and cold occlusions. It turns out there is only one - the cold occlusion - with cold air on both sides.

Retrieved from http://www.atmos.washington.edu/~houze/301/protected/Notes/CompObsMaps.pdf

Fronts are responsible for clouds and precipitation, but explaining that and a lot of the other intricacies of fronts wouldn't be the best use of my time. If you are interested in that stuff, I recommend clicking on the links above where I am getting the pictures from.

One last thing that I think is important, however, is the relationship between ridges and troughs in the upper atmosphere and fronts at sea level. Fronts tend to form on the right edge of the trough as it transitions into the ridge. The trough and low/front move at the same speed, but remember, not all troughs themselves move at the same speed. Those with shorter wavelengths move faster than those with longer wavelengths.


Shortwave troughs are also commonly superimposed on longwave troughs. Imagine a worm wiggling, and then these wiggles having their own individual wiggles associated with them. That's what the upper atmosphere is like. A worm wiggling its own wiggles.

Now, onto thermodynamics!

Charlie

Wednesday, October 30, 2013

ATMOS 301: Surface Station Models

Wednesday, October 30, 2013
9:16 p.m.

One thing I never really paid attention to coming into this class was the surface station models. They are helpful and all, but they are difficult to look at. I mean, take a look at this chart below. It's ugly enough as is, and to think that it's a simplified version of what is usually used... well... you can see why I'm not a big fan of them.


But they are an essential part of communicating weather observations, so let's take a look at some!

http://www.atmos.washington.edu/~houze/301/protected/Notes/CompObsMaps.pdf

Above is a wonderful graphic from a PDF put together by Professor Houze himself. Some parts of the diagram are is pretty self explanatory, but there are several more advanced features, namely pressure, wind, cloud cover, and "current weather". Temperatures are in Fahrenheit.

Pressure:

The pressure is not 138 mb. Atmospheric scientists are too lazy to add that 10 at the beginning. However, if the pressure reads something like 999, that DOES NOT mean that the pressure is 1099.9 mb. My head might very well explode under conditions like that (not really, but no atmospheric pressure ever recorded on Earth is that high). Instead, you add a 9 to the beginning. Determining whether to add a 9 or a 10 is pretty easy, and although there are situations where there could be an overlap (for example, 400 could correspond to 940 for a tropical cyclone or 1040 for a strong ridge of high pressure), you can just look at nearby stations and other indications on the map to get an idea of what the prefix is.

Wind:

Wind is not measured by numerical units. Instead, we have barbs. Small barbs are equal to 2.5 m/s, while large ones are equal to 5 m/s. When it gets really windy, we also use flags, which are equal to 25 m/s. The diagram below shows a nice example of some different wind barbs. However, keep in mind that the below one uses knots. To get meters/second, just divide knots by 2. If we tried to use knots for that intense 150 knot jet at the 200mb level of the atmosphere, we'd only be making a bad situation worse.

Retrieved from the "Weather Informer" blog - http://brianmejia.wordpress.com/terms-concepts/

Cloud Cover:

Cloud cover is denoted by that circle at the middle. In the example above, it is black, but it is not always black. The chart below is pretty self explanatory. "Sky obscured" generally means fog, although I guess it could represent a cumulocannibis cloud arising from one of the bored forecasters at the airport as he toked up while simultaneously taking cloud observations. You think all the fog lately has been because of an inversion? Maybe, but let's just say there's a little more particulate matter there this year than last year.

Retrieved from http://weather.about.com/od/forecastingtechniques/ss/mapsymbols_4.htm. Yes, about.com is legit.

Current Weather:

Temperature, wind, and all that jazz are all very nice, but we want to know what's actually happening at the station. And that's where the current weather symbols come in. These symbols generally let us know what's happening precipitation-wise. Take a look below.


Retrieved from http://www.hpc.ncep.noaa.gov/html/stationplot.shtml

If none of these are happening (ex: the sky is clear and sunny and there are no crazy dust devils or haboobs going on), I wouldn't be surprised if this part is simply omitted. But I don't know for sure. Here's what the NWS claims to be signals they claim to use 99% of the time.

I'd definitely practice the surface station model stuff for the test, there could very well be a question on it. On to the next blog!

Charlie

ATMOS 301: Composition and Fundamental Physics

Wednesday, October 30, 2013
11:24 a.m.

Greetings everybody. I hope you'll forgive me for my lack of recent posts. You see, there's this thing called college, and, well, it has these things called midterms. And these midterms, well, they take up a fair amount of your time and energy. And by a fair amount, I mean an unfair amount.

Speaking of midterms, I have another one on Friday. So why the dickens am I writing a blog? Well, this midterm is in my atmospheric sciences 301 class! What better way to study than to try and communicate these concepts to the public. Of course, whether you are interested in them remains to be seen. But hopefully you can find my writing engaging and learn a couple things along the way.

There are a lot of things to cover, but let's start with some of the basics. First off, the class website is http://www.atmos.washington.edu/~houze/301/, and if you want to login to anything, the username is 301 and the password is weather.

Composition of the Atmosphere

The atmosphere is made up of three main gases. These are:
    -  Nitrogen (78 %)
    -  Oxygen  (21 %)
    -  Argon  (1 %)

These fellas make up the so-called "permanent" gases of the atmosphere. But they are by no means the only gases, even though the rounded percentages may suggest otherwise.

Below are the "variable" gases of the atmosphere.

    -  Water Vapor ( 0-4  %)
    -  Methane
    -  Carbon Dioxide
    -  Nitrous Oxide
    -  Ozone
    - CFCs (Chlorofluorocarbons, which are those things which destroy the ozone hole)

Water vapor is by far the most variable. The poles aren't exactly dripping in moisture, while the tropics... well... you get the idea. And after being in Micronesia over the summer, that is something I can verify.

In addition to the gases outlined above (and others that I have not mentioned), there are particulates, or aerosols, as atmospheric scientists like to call them, scattered throughout the atmosphere but primarily in the troposphere. Sea salt, volcanic ash... they're all there, and they play a major role in other atmospheric processes such as condensation and precipitation, which I will talk about in a future blog.

Pressure, Temperature, Humidity, and Wind

I feel as though these things are those types of things that you think that you know, but when somebody asks you to define them, do realize that you don't really know them. We all know what politicians are, but when somebody asks you what a politician is, how are you supposed to respond? Personally, I'd just say something like "A guy who does things." Some dude on Urban Dictionary summed it up well when he said a politician is "a person who practices politics," where " "politics" is derived from the words "poly" meaning "many", and "tics" meaning "blood-sucking parasites." "

Pressure

Pressure is equal to force/area, and if anybody here knows their physics, they can recall that F = ma, where F = force, m = mass, and a = acceleration. In SI units (or, as the French like to say, Le Système International d’ Unités), force = kg*m/s^2, where kg=kilograms, m=meters, and s^2=seconds squared. So force/area = kg*m/s^2 * 1/m^2 = kg/(m*s^2). Voila. There's your definition of pressure.

While were on the subject of pressure, let's talk about other non-SI units we use. How many of you are familiar with a mercury barometer? For those who aren't, it consists of a dish of mercury that is able to freely flow up a tube with no air inside it due to the force of the atmosphere pushing down on the exposed mercury in the dish until the weight of the mercury balances the weight of the atmosphere above it.

From the UW Atmospheric Sciences' very own website! http://www.atmos.washington.edu/2007Q3/101/LINKS-html/MercuryBarometer.html

We use inches and millimeters of mercury to describe the pressure. Mean sea-level-pressure is 760 millimeters or 29.92 inches of mercury. We also use hectopascals and millibars, where 1 hectopascal = 100 pascals and 1 bar = 1000 millibars. Hectopascals and millibars themselves are equivalent, and mean sea-level-pressure in those units is 1013 mb/hPa.

One more note... atmospheric scientists like to use pressure instead of height as the vertical coordinate. Instead of hearing guys talk about what's happening at 18,000 feet, you'll hear them talk about what's happening at 500mb.

Temperature

Temperature is manifested for us beings by how hot we feel. But in the world of physics, it is defined as the average kinetic energy of molecules. By kinetic energy, I mean the average amount of which these molecules zip, zap, whip, and snap around. That's it. When two parcels of air of different temperatures are combined, the momentum carried by the different speeds at which molecules are moving around is transferred and the temperature equalizes. It's not magic. It's physics.

Humidity

There are many different ways to express humidity. Let's go over my two favorite ones.

Relative Humidity:

At a certain temperature and pressure, only a certain maximum of water vapor molecules can exist. The higher the temperature, the higher the maximum. I'll get more into this when I talk about skew-t plots. The relationship is exponential, meaning as the temperature increases, the maximum amount of water vapor increases even more.

Dew Point:

The dew point is the temperature at which are must be cooled at constant pressure to produce saturation. Don't forget that constant pressure tidbit. The dew point is a measure of the actual amount of water vapor in the air. Another measurement meteorologists use is the dew point depression, which is defined as the ambient temperature minus the dew point.

Without further ado, I'll begin my writeup on my next topic: surface station models. It'll be a short one, but could be one of the most important things to study for the test, so the ~4 Facebook friends I have that are taking the class should take a solid gander.

Wind:

Remember the politics analogy? "What is wind?" Well, you could say that it is the air moving. And actually, you'd be close. Wind is defined as the velocity of a percel of air with respect to the surface of the Earth. The Earth is moving too, folks, but if the air is moving in the same exact manner as the Earth, there is no wind because there is no relative motion between the atmosphere and the Earth.

Because wind is velocity and not speed (speed is a scalar, meaning it is only assigned a numerical value, while velocity is a vector, meaning it has a numerical value and a direction), our equation for wind is v = ui + vj + wk, where v is the velocity vector, and i, j, and k are the unit vectors in the x, y, and z direction. The u, v, and w coefficients respectively associated with the unit vectors actually determine the direction of the vector. ui denotes zonal flow (east-west) and vi denotes meridional flow (north-south).

We don't use the k vector when talking about wind direction. For example, the wind is from the northeast, not from the northeast plus a specified height per unit distance.

Friday, October 18, 2013

The Omega Block

Friday, October 18, 2013
5:57 a.m.


There's a lot of things that suck in life. I'm not quite sure if I've gotten any sleep tonight, and that definitely sucks. But there is something that sucks even more than not being able to fall asleep, and that is called an "omega" block. The "omega" stems from the configuration of the 500mb heights in the atmosphere.

First, let's review what a capital omega looks like.

Here ya go.


Here is a capital Omega, the 24th and last letter of the Greek alphabet. Taking so many math and science classes, I get enough of these guys as is.

Below is an idealized diagram of the aforementioned block that I retrieved through UCAR's MetEd program. The program is free and is a great resource for not only weather enthusiasts but for those involved in larger educational and commercial fields. Check it out.


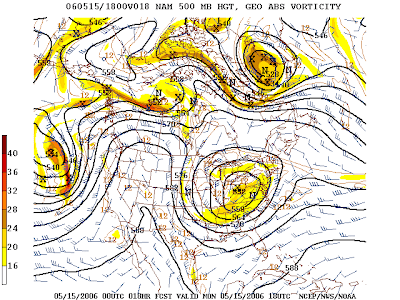
Now, take a look at a NAM chart all the way back from 2006. You can clearly see two closed lows on either side of a large ridge of high pressure.

A NAM representation of an Omega Block over the United States back in May of 2006. Created by NCEP. Retrieved from Wikimedia Commons. Chart URL: http://en.wikipedia.org/wiki/File:NAM_500_MB.PNG

See the correlation? Omega Blocks actually look pretty cool on models, but they will give any storm chaser a nightmare. Or two. Or three.

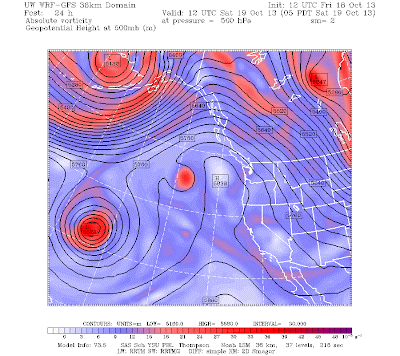
The reason? Once these blocks come up, they are stubborn as heck. Here's the chart for today:

It's not a "classic" Omega Block; it only has a closed low to the west of the high. Still, there is a very large trough to the east of the high, and the whole chart definitely still looks like it should be plastered on the outside of a fraternity. As I write this this sentence, it's actually 5:55 p.m. in the KOMO weather center (I was finally able to fall asleep at around 7), so let's take a look at this morning's 12z WRF-GFS 500mb height charts.

Valid 05:00 am PDT, Fri 18 Oct 2013: 500mb Heights, Absolute Vorticity. UW WRF-GFS 36km Resolution: Initialized 12z Fri 18 Oct 2013. Retrieved from the Pacific Northwest Environmental Forecasts and Observations website. Model URL: http://www.atmos.washington.edu/~ovens/wxloop.cgi?mm5d1_x_500vor+///3
This is the chart for the model initialization (forecast hour 0). As the succeeding charts show, we stay in a boring pattern for the next several days.


The above WRF-GFS charts show the Omega Block breaking down. To the untrained Pacific Northwest storm lover, this may look like good news. But in actuality, it's the worst thing that could happen. Why? Because a "Rex Block" will take its place.

This block does not resemble some brain-dead bloodthirsty beast, even if I do when one is situated over the area. Rather, it is named after Dr. Daniel F. Rex, a Commander in the Office of Naval Aerology and one of the founders of the NCEP (National Center for Environmental Prediction), which is the organization that develops and executes many different models that the United States (and many other countries around the world) use. Simply stated, a rex block has a high situated on top of a closed low. These blocks are even more stubborn than omega blocks. Let me put it this way... an omega block is to a filibuster as a rex block is to a government shutdown. And they will most definitely give any storm chaser a nightmare. Or four. Or five.


Let's take a look 180 hours in the future, which is the furthest the WRF-GFS goes out. Viewer discretion is advised.

Valid 05:00 pm PDT, Fri 25 Oct 2013 - 180hr Fcst: 500mb Heights, Absolute Vorticity. UW WRF-GFS 36km Resolution: Initialized 12z Fri 18 Oct 2013. Retrieved from the Pacific Northwest Environmental Forecasts and Observations website. Model URL: http://www.atmos.washington.edu/~ovens/wxloop.cgi?mm5d1_x_500vor+///3

That's a rex block, no doubt about it. grrr...

If there's a silver lining, this thing will break down eventually, and when it does, we'll be in for a neutral November. And looking back at November 2006, I think we can all appreciate how exciting those can be. :)

Have a good one! (inside KOMO joke) ;)

Charles

Thursday, October 17, 2013

100,000 Views

Saturday, October 12, 2013
10:39 p.m.

Hey everybody, sorry for not getting this up earlier. I had a seizure on Monday and have been resting ever since. I finally went to all my classes today, and I'm seeing the neurologist tomorrow. This is my fifth seizure in the past two months, so hopefully we can put an end to all this nonsense soon. I've got blogs to write.

I've been pretty active in the weather department lately. This quarter, I'm finally taking some majors' atmospheric sciences classes, and let me tell you, learning about the development of cyclones is a whole hell of a lot interesting than having to retake MATH 324 (Advanced Multivariable Calculus) and the associated examinations on interpreting things like the Newton-Leibniz-Gauss-Green-Ostrogradskii-Stokes-Poincaré formula (commonly called called Stokes' Theorem) a second time. I recently got an internship at KOMO with Steve Pool (I'll talk about that in a different post), I've been working with Tanner on continuing to develop WeatherOn, I've been developing relationships fellow undergrad and graduate students, and of course I've been doing my best to forecast the weather when time allows. I was in the ICU throughout this past week trying to do all the homework I procrastinated on the previous week (still getting back in that college rhythm) and decided grades aren't as important blogs*, but now my assignments aren't due for several days, so I can get back out of rhythm.

*If severe weather is forecast, blogs take priority over not only homework but over friends, family, and just being a good person.

Anyway, the last blog I wrote was on the 5th, and when I checked out my published post, I noticed that my blog was on the cusp of 100,000 views. I anxiously checked it several times over the next several days while making sure not to go overload as to artificially inflate the number of hits the page had tallied over its lifetime. The below screenshot was taken on 4:18 p.m. that day.


I definitely checked more than twice, but the blog has, as of 2:22 a.m. October 13, 2013, amalgamated 100,527 views since my first post on it back on October 17 of 2009. It is worth noting, however, that I actually started doing these forecasts in April of 2008 on a Facebook group I created before making the switch to Blogger. Those old forecasts were much more forecast-y in nature, whereas now this blog is now a running tapestry of my thoughts.


Thankfully, I don't think about much else besides weather. You can bet that this blog will stay right where it is for many years to come. :)

Charlie

Saturday, October 5, 2013

Please Pay Us

Saturday, October 5, 2013
5:32 p.m.

I was talking with Steve Pool last week about political parties. The Democrats and the Republicans are at such ends with each other, and because they are always debating or filibustering or doing something counterproductive, they never get anything accomplished. They contest when they should compromise. They quarrel when they should coalesce. Therefore, I proposed a three-party system: the Democrats, the Republicans, and the Reasonables. The Reasonables would, well, be reasonable, and our country would be so much better off.
Actually, what they should do is have a boxing match available on pay-per-view. That would be great, and it would resolve things much quicker. It's hard for somebody to filibuster when they've been knocked unconscious. But that doesn't look very convenient. At least not right now.. hehehe ;)

I was reading Scott Sistek's Partly to Mostly Bloggin' Blog and came across an interesting forecast discussion by the NWS guys up in Anchorage. You can read Scott's blog on the topic by clicking the link above, but I thought I'd just share it with you briefly. I got the below picture from Scott's latest post.


I think this is brilliant. Lots of NOAA sites have been down recently due to the shutdown, and the only ones that have been up are ones that are necessary to protect life and property. The NWS falls under this category... it would be pretty disastrous if they weren't allowed to issue a tornado warning when one was headed for downtown New York City. If you type in www.noaa.gov in your web browser, it automatically takes you to http://governmentshutdown.noaa.gov/, where you see the below message.


I don't know if the NWS forecasting dudes at Anchorage were referring to themselves or others affiliated with NOAA who are out of work, but this is probably the second-best forecast discussion, watch, advisory, warning, special weather statement, hazardous weather outlook, etc ever issued. The first best was a prank I pulled on my mom when I was in 6th grade and a snow advisory had been issued for our area. I changed a few key words to make the storm sound apocalyptic and replaced the advisory with a blizzard warning, and then I printed out and came sprinting to my mom with the 'exciting news.' She completely fell for the prank until I explained to her what I had done.

The "warning" remains, to this day, on the door into our kitchen. If I ever go into the field of writing forecast discussions for the NWS, I'll make them accurate, but I won't make them any less entertaining than the stuff you read on this blog.

Charlie