Thursday, October 15, 2015

Why Are Our Evergreens Turning Brown?

Thursday, October 15, 2015
3:52 pm

Every autumn, our beloved deciduous trees shed their leaves, creating an annual economic boom for children everywhere as parents and neighbors pay them the proverbial quarter to rake excess leaves off their lawns. Of course, once these upstart entrepreneurs have reaped the monetary rewards of their labor, they get to romp around in the leaves until they are spread all over the yard again. I would give anything to go back to those days. But since I can't, I'll bore you with a blog on tree biology.

Credit: mastercoaches.com

These types of trees are called "deciduous" trees, while those that keep their leaves all year long are called "evergreens." However, even evergreens do a little shedding, and this autumn, they appear to be more ambitious than usual.

I happen to have a pretty sizable Western Red Cedar in my front lawn, and this bad boy is as brown as I have ever seen it. I took this picture on Monday the 12th, and it really makes you question whether this cedar tree is deserving of the title "evergreen."

Flagging on a cedar tree in my front yard. Taken October 12, 2015

So what's with the brown "flagging" on this Cedar tree? Why are the evergreens doing this so much this year, and will there be any green left for our winter? The answer is yes, and there are two main reasons why.

First, we had a hot and dry summer. Cedars and many other conifers (trees with needles, like Firs, Spruces, Pines etc.) have relatively shallow root systems. This makes them vulnerable to drier and hotter-than-normal summers, as the upper soil responds more quickly to precipitation and heat than the soil deeper down.

A Douglas Fir pulled straight out of the ground at Avery Park, Oregon due to the Hanukkah Eve Storm of 2006. Note how shallow the roots are. Credit: Wolf Read's Storm King Website

This summer, soil moisture was significantly less than average both in the lowlands and mountains, which did not have the benefit of a large winter snowpack to keep the ground moist well through spring. The majority of water loss from a tree occurs through its foliage, so it makes sense that the tree would kill some of these needles to conserve water. If water was low but the tree kept all of its leaves, it would lose even more water, potentially killing the tree. Cedars always flag in the autumn, so the fact that this summer was much hotter and slightly drier (our heavy rains in August made up for much of our deficit) than normal explains why the flagging this year is more prominent than years past.

Second, conifers shed old limbs so they can devote more resources and water to growing new ones, meaning that even in the wettest of years, cedar trees still undergo flagging. On average, Seattle only gets 37 inches of precipitation a year, which is approximately the same amount that Dallas gets. If our trees tried to equally distribute water, they would grow very slowly. Trees in the Hoh Rainforest tend to experience less flagging because of the wetter climate, but needles that are several years old still die every year as the tree focuses on new growth, allowing them to grow to unbelievably massive sizes.
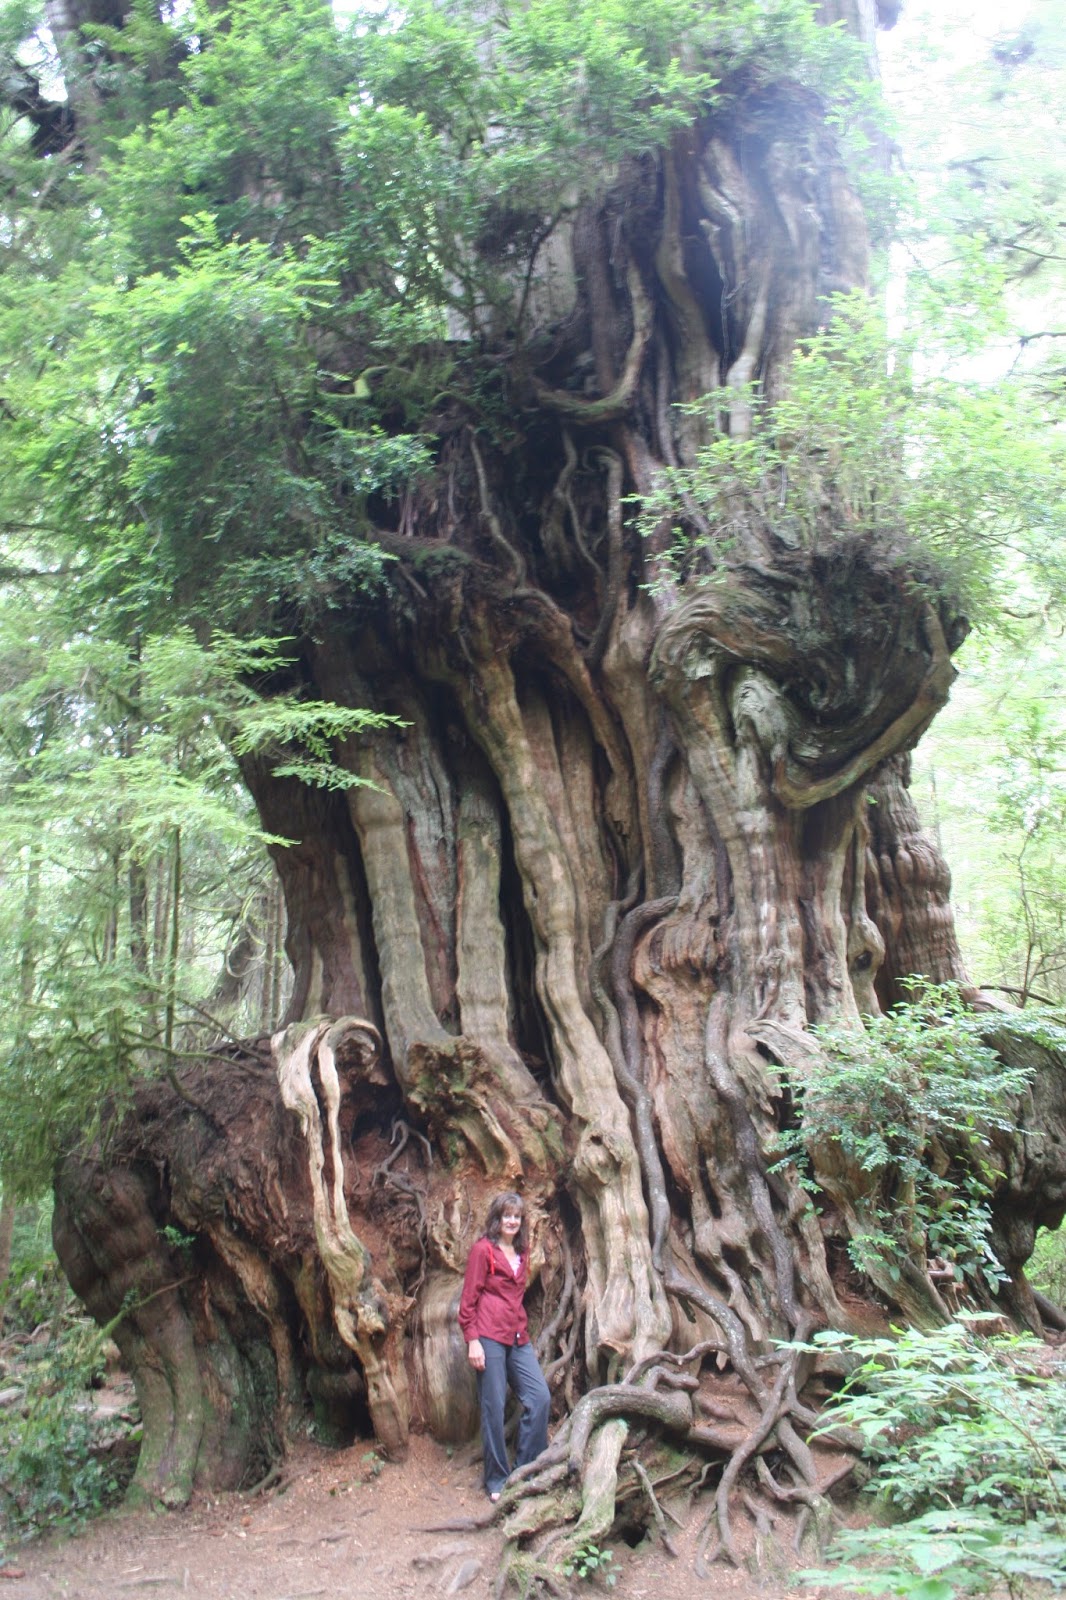
"Big Cedar Tree" with a girth of over 66 feet in Olympic National Park. Credit: Tom and Dianne's North American Adventure

Although the term "flagging" is mostly reserved for cedars, most conifers shed old needles in the autumn, particularly after a hot, dry summer.

There are a number of conifers that actually are deciduous. Most of these are Larches, but some Cypress trees and even the Dawn Redwood have this quality. Meanwhile, there are some non-coniferous trees and shrubs that are evergreens. For example, our state flower, the Pacific Rhododendron, is an evergreen shrub.

A Pacific Rhododendron in Olympic National Park. Credit: Walter Siegmund

Hope you enjoyed a different type of weather blog for today! It's fun to mix things up. Keep an eye out for WeatherOn's winter forecast, which will be released on November 1st. Right now, it looks like we are going to be warmer and slightly drier than normal, but nowhere near as warm as last year. I'd still hold off on a seasons pass until the 2016-2017 winter though.

Peace!
Charlie

Thursday, October 8, 2015

The Tragedy of Climate Misinformation

Wednesday, September 23, 2015
3:52 pm            

Albuquerque Tea Party, April 2009

Global warming deniers come in all shapes and sizes. Some are quite bold in their statements, denying any reasonable scientific claim, and instead claiming that global warming is a 'socialist scam.' Others are more subtle, claiming that evidence for the Earth warming is "inconclusive." And then there are others that claim that yes, the Earth is indeed warming, but there is no evidence that humans are causing it. Some will go so far as to say that the very thought of humans being able to influence the climate is a manifestation of the arrogance of mankind. Pretty ironic, huh?

Credit: http://militantlibertarian.org/

But we also know about the global warming alarmists. The "Chicken Littles" of society. Just like the deniers, no matter what you say to them, they'll deny the science and instead claim that global warming is going to destroy us all. And just like the deniers, there are the true "air raid siren" alarmists who go door-to-door prophesying the end of the world as we know it, and those who simply pass on alarmist misinformation from biased, unreliable sources.

I firmly believe that the vast majority of both deniers and alarmists are not to blame for their ignorance when it comes to climate change. Instead, I think the blame falls on a few self-appointed experts on climate change, our politicians, and most of all, the media.

I did a quick Google search for "Climate Change," and here are some recent news articles I found.

The Guardian
Breitbart
Grist
The Guardian

Articles like these frustrate me immensely. The first article ties a slight (10% increase over the past few decades) increase in precipitation to massive rainfall totals this year that destroyed pumpkin crops, thus blaming climate change on pumpkin pie shortages. Yes, climate change will increase precipitation intensity in many places around the world, but blaming a massive rainfall event solely on climate change? There are so many other variables to consider, most notably the goliath El Niño event currently underway in the tropical Pacific. As far-fetched as this article is, it is significantly more reasonable than the three below it.

Breitbart

I also checked out the positions on climate change of the top two GOP candidates from the most recent Pew Research Center poll this October. Front runner Donald Trump (25%) says climate change is a hoax created by the Chinese to distract the United States and allow the Chinese to overtake our economy, while Ben Carson (16%) believes that the climate changes any time that the temperatures go up or down. This theme is common throughout the party, both for the candidates and the others in politics. I believe that most of them actually do believe that anthropogenic climate change is real, but they deny it to gain support from certain industries and their voter base.

Finally, let's not forget about the wacko scientists who make false claims about global warming.

Dick Lindzen. Credit: The Cato Institute

The most notorious of these climate swindlers is Dr. Dick Lindzen of MIT. The thing about Dr. Lindzen is that he is a very smart dude. If I had a debate on climate change with him, I would lose, even though I am right and he is wrong. He has published over 200 scientific papers, and was the Alfred P. Sloan Professor of Meteorology for 30 years. He even did work for the Intergovernmental Panel on Climate Change. He focused his career on atmospheric dynamics and significantly advanced knowledge of that area in our field. He's a genius.

But he's also a contrarian. Not only does he deny anthropogenic global warming, he denies that smoking plays a significant role in causing lung cancer. It's OK to have opposing viewpoints when evidence supports them, but Lindzen relishes the contrarian label. Numerous scientists, including professors I know, have categorized him as "intellectually dishonest," "deeply unprofessional," a "formidable opponent," etc. Naturally, he's gone on places like Fox News to discuss his views, and viewers just assume he is right because of his credentials. If I didn't know anything about climate science, I know I would.

Another disturbing thing is that, according to a 2015 George Mason University study, only 74% of broadcast meteorologists believed that human activity was at least half to blame for global warming. When this study was done in 2011, only 65% of broadcast meteorologists held this view.

With all of this misinformation floating around, it's no wonder that the public is so confused about climate change.

I believe that things will get better as time goes on and global warming becomes more apparent. There will be fewer and fewer deniers, both in the atmospheric science community and elsewhere, and as climate change becomes more and more of a mainstream topic, the public will become better educated on what it actually is.

In the meantime, there are some fantastic resources for getting accurate information on climate change. I highly suggest reading the EPA's page on climate change, and NOAA's Earth Systems Research Laboratory is a great resource as well.

One of the biggest misconceptions floating around is that you can attribute an individual event to climate change. For example, right after Hurricane Sandy, there were tons of articles linking that singular event to climate change, even though there was some evidence that hurricanes in that part of the Atlantic would be less likely under global warming. Asking whether an individual event can be attributed to climate change misses the entire point of climate change... it focuses on long term climate, not day-to-day weather. Every weather event is affected by anthropogenic global warming because the climate in which it occurs is warmer and moister than it otherwise would be if humans never emitted greenhouse gases. In order to truly see evidence of climate change, you have to look for signs of the climate, well, changing. Hurricane Sandy is not an example of the climate changing, but the Earth warming over 1.5 degrees Fahrenheit since 1880 is.

Credit: NOAA's National Climatic Data Center

And when you consider that 93% of the additional heat due to man-made climate change is going into the ocean compared to just 2% for the atmosphere, you can see that global warming is very real, and very serious. But it as serious as this?

Credit: History Today

I don't know about the UK minister, but I'll take global warming over nuclear war.

Charlie

Tuesday, October 6, 2015

Will Hurricane Oho Impact the Pacific Northwest?

Tuesday, October 6, 2015
3:29 pm

A tower atop Campbell Hall, Western Oregon University collapsing under the 100+ mph winds of the Columbus Day Storm. Credit: Wes Luchau, Statesman Journal

The Pacific Northwest has never gotten hit by a hurricane and never will. Our waters are simply too cold to sustain a tropical system. For a hurricane to form and keep its strength, you generally need to have 80+ degree water extending from the surface to at least 150 feet. The summer water temperatures off our coast are in the mid-50s due to the upwelling of deep, cold, nutrient-rich, acidic water (good for salmon, bad for Willapa Bay oyster larvae). But we can get the extratropical remnants of these storms, and due to the deep, tropical moisture source they provide, they can turn into quite vicious midlatitude cyclones.

The strongest of these was the Columbus Day Storm, which devastated the entire Pacific Northwest on October 12, 1962. No extratropical storm we've seen here or anywhere else in the United States can compare to the winds witnessed on that day. Not Superstorm Sandy, not the "Storm of the Century" of 1993, and certainly not the "Perfect Storm" of 1991. The map of peak gusts from the storm below speaks for itself.

Credit: Wikipedia User Spiritchaser

The Columbus Day Storm started out as Typhoon Freda, which reached category-3 status and had a minimum pressure of 948 millibars. As it traveled north, it became more entrained in the prevailing midlatitude westerly flow, and as a result, it weakened into an extratropical cyclone just before the International Date Line. As you can see, it sped up tremendously while retaining its structure. Just off the Northern California coast, it explosively redeveloped after interacting with a very strong jet stream, and the Columbus Day Storm was born (or resurrected, depending on how you see it).

The track of Typhoon Freda. The points are at 6-hour intervals, and circles represent a tropical system, while triangles delineate an extratropical one. Credit: Supportstorm

Yeah, it's fair to say I'm pretty obsessed with the Columbus Day Storm. It just kills me that I wasn't there to experience it. Nonetheless, I can't help but get excited every time there is talk of an ex-hurricane or typhoon hitting us. 

As it turns out, there is a specific tropical cyclone a little bit east of Hawaii. And the name of that tropical cyclone is Hurricane Oho.

Credit: Central Pacific Hurricane Center

Fortunately, Hurricane Oho does not appear to be a serious threat to the Pacific Northwest. This evening's model runs are forecasting a landfall near Haida Gwaii as a strong and compact extratropical storm. However, this morning's model runs showed it coming ashore Vancouver Island as a weak blob of rain. The general trend with the models has been to push Oho further westward and make it stronger, so while I doubt we will feel any effects here besides a few showers from a trailing cold front, it will be interesting to watch how this system evolves. The latest UW WRF-GFS model shows it making landfall as a 963 mb cyclone Friday morning, which is not that much weaker than the Columbus Day Storm. 

Valid 11:00 am PDT, Fri 09 Oct 2015: UW WRF-GFS

I'm not gonna lie... I'm a little bummed that Oho has its sights set on Alaska, and I don't think that will change. Still, it will be fascinating to study Oho's evolution from a tropical to an extratropical system as it races north, especially near the 53rd anniversary of the Columbus Day Storm. Stay tuned... this will be a storm to watch!

Thanks for reading,
Charlie

Monday, October 5, 2015

Historic Flooding in South Carolina

Monday, October 5, 2015
2:49 pm

Flood waters in Charleston at intersection King Street and Huger. Credit: US Army National Guard

The Pacific Northwest is no stranger to flooding. I believe that Washington has had the most federal disaster declarations of any state, which may be surprise you due to our seemingly-mundane weather. But we get these massive floods from time to time, and we also have a tendency to get strong winds, especially on the coast. We have extremely heavy snows and avalanches in the mountains as well. Our natural disasters aren't just limited to the weather... we've got earthquakes, volcanoes, and landslides too. Let's not forget about those wildfires either. When you think about it, we live in a pretty disaster-prone place, even though it might not seem like it when it rains an entire day and we've only got a tenth of an inch of liquid sunshine to show for it.

But there are times when we are reminded that no matter how hard we try, we just can't outdo some of the severe weather found in other parts of the country. And this is one of those times.

The stalled rain band over South Carolina on 16:10z October 3, 2015. Notice Hurricane Joaquin to the southeast. Credit: NASA Worldview Terra MODIS Satellite

South Carolina is just recovering from an extraordinary rainfall event, and North Carolina got hit pretty hard as well. The rainfall was primarily caused by two things: strong easterly flow due to a low pressure center over the southeast and a high pressure system way up north by Hudson Bay and convergence due to air circulating around the southeast part of the low. Converging air rises and forms clouds and precipitation, and in this case, there was a lot of convergence, and therefore a lot of rain. Additionally, once this stream of moisture went ashore and interacted with terrain, the air was forced to rise more, resulting in even heavier rainfall. This rain was NOT directly associated with Hurricane Joaquin, which was just to the southwest. However, Joaquin did provide a tropical moisture source which further contributed to the heavy rainfall. In the end, the strength of the convergence, the uplift from terrain, the stationary nature of the rainband, and the influence of nearby Hurricane Joaquin all combined to create a massive flooding event for Southern Carolina.

Rainfall accumulations across the Carolinas and surrounding states from October 1–4, ending at 6:24 p.m. EDT (22:24 UTC). Areas in white indicate accumulations in excess of 20 in (510 mm). Credit: Raleigh, NC NWS Twitter Page

The picture above shows 4-day rainfall totals from October 1-4 ending at 6:24 pm EDT on the 4th. As such, it does not represent final rainfall totals, but it represents most of what they got. The rainfall is off the charts. The chart only goes up to 16 inches, but those areas of white that you see in South Carolina represent areas where over 20 inches were estimated to have fallen! The Pacific Northwest has had very impressive rainfall totals before, but I can't remember anything like this, especially for lowland areas. For South Carolina, many locations got over 20 inches, and while this was measured over four days, the majority of the rainfall occurred over the weekend. Here are some South Carolina rainfall statistics I found on weather.com (I'm sure they got them from the National Weather Service). Amounts are in inches, and these are through October 4th.

Mount Pleasant: 26.88
Kingstree: 21.80
Dalzell: 21.66
Georgetown: 20.95
Sumter: 19.43
Summerville: 17.75
Charleston Airport: 17.29
Moncks Corner: 17.02
Charleston (Downtown): 16.29
North Myrtle Beach: 13.84
Columbia (Downtown): 11.93
Greer: 6.30

By the way, the previous state record for most rain in 24 hours was 14.80 inches, set in 1999 with Hurricane Floyd. Numerous places smashed this record.

Mt. Rainier National Park: Left pic, November 5, 2006. Right pic: same location two days later. Credit: National Park Service

Washington has had many major flood events, and I remember one back in November 2006. An incredible amount of rain fell throughout Western Washington and the Cascades from November 5 to November 7. I went to Snoqualmie Falls on November 7 - a Tuesday - and it was as muddy and high as I had ever seen it. It was something of a spiritual experience for me. Still, Seattle got 3.29 inches on the 6th, good for our 4th rainiest day ever (the rainiest day was October 20, 2003, when Sea-Tac picked up 5.02 inches of rain!). Meanwhile, Charleston got 11.50 inches of rainfall on Saturday, breaking their old record of 10.52 inches set back on September 21, 1998. We can get very wet here and have catastrophic flooding both in the mountains and very rarely in Seattle (the December 14, 2006 flood comes to mind, where a woman in Madison Valley died), but being in such a moderate climate, we tend not to see the flash flooding that South Carolina got this past weekend.


You'll see many media reports saying that this is a "once in a thousand years" flood event. I decided to take a look at this, and it turns out that while this event is unprecedented in many areas, the "once in a thousand years" might be a bit overstated. Technically speaking, "once in a thousand years" means that an event of this magnitude has a .1% chance of occurring any given year, but headlines like "South Carolina Reeling From ".1% Chance Of This Bad Of A Flood Occurring Any Given Year" Flood" just don't, well, make that much money.

There's also talk of climate change, but keep in mind that heavy rainfall events have always happened and always will. There is evidence that heavy rain events will increase in severity (for example, more "Pineapple Express" flooding events are expected here in the Pacific Northwest in a warming climate), but it is far from conclusive. Besides, the global warming signal is fairly weak throughout the globe right now with the exception of the far northern latitudes. Long story short... let's talk about the "new normal" in 2100, when our climate will be significantly different from what it is today. The climate is not much different today than it was 20 years ago.

Historic rainfall in SC -- only happens once every 100-200 years. Credit: https://twitter.com/NWSRaleigh

The National Weather Service compiled a neat little graphic showing the return period of events like these, and it looks like it's more of a 100 to 200-year event for most places. There are some places where it looks to be off the charts and that the "1000-year event" label is justified, but these places look few and far between. The media can be very misleading... don't let it fool you!

Enjoy the nice weather here! We'll have a couple weak systems coming through this week, but nothing major. However, I don't think it's misleading to say that storm season is right around the corner!

Thanks for reading,
Charlie

Friday, October 2, 2015

Another Heat Record Bites The Dust/Thoughts on The Blob

Thursday, October 1, 2015
4:08 p.m.

"It ain't the heat, it's the humility" - the late, great Yogi Berra

At Sea-Tac, the last time we had a month that was cooler than average for that month was February 2014. Since then, 20 months have passed, with 19 consecutive months being warmer than normal. That's right... this September was the first colder than normal month since February 2014.

We've broken some impressive records in that time. Our records to Sea-Tac go back to January 1948, but within the span of these months, we've broken two all-time records for hottest months (March 2015 and June 2015). In addition, December 2014 and June and July 2015 broke records for all-time highest maximum temperature, and October 2014 and February, March, June, and July 2015 broke record for all-time highest minimum temperature. In other words, these 19 months weren't just warm, they were scorching!

Why so warm?

Two answers: a massive and persistent ridge of high pressure, and a larger-than-life blob of boiling-hot (OK, maybe not that hot, 2-3 degrees warmer than normal) water in the Northeast Pacific. With this ridge, instead of getting cool, northwesterly flow from the Gulf of Alaska and places to the Northwest, we got warmer flow originating from our south, and our surface winds were often offshore, further warming us due to downslope adiabatic warming effects off the Cascades (that's fancy terminology for the phenomenon of air warming as it sinks). With the warm water, onshore flow off the Pacific into our region was often at least 2 degrees higher than it would have been due to the long time it spent over the Blob of warm water. 

The picture above shows our sea-level-pressure compared to normal values, and you can clearly see that we had higher than normal pressure this summer. As you can see, we clearly had higher than normal pressure over the Northeast Pacific this year.
This ridge of high pressure was associated with relatively little mixing of the ocean, so the surface got nice and warm instead of having this warmth being mixed down deep by storms and waves. Also, these ridges are associated with sunny skies, so the sun heated the ocean.

I was unable to find out how to get a similar chart to this for sea surface temperature (SST), but as you can see from the February-March 2015 SST anomaly chart below, the "Blob" is located in the same area that the higher-than-normal pressure is located. This is not a coincidence! The Blob is a direct result of this higher-than-normal pressure.

As you can see below, the Blob wasn't just present in 2015. It was there in 2014 too; in fact, that is when it was first named. It was a bit further west, and a bit more "blob-like" then (at least in my opinion).

Credit: NOAA Earth Systems Research Laboratory: Physical Science Division

So, why did this persistent ridge of high pressure (and the resulting Blob) occur? There's been a lot of study concerning it, particularly at the University of Washington, where Professor Nick Bond (great guy, had him for my senior capstone forecasting course spring quarter) first came up with the "Blob" name. It turns out that the high pressure looks to have originated from atmospheric waves originating from the western Pacific. On a larger time scale, the Pacific Decadal Oscillation, an oscillation in Pacific Ocean temperatures on 20-30 year time scales that has atmospheric implications, may be a factor. Finally, some studies like those by Diffenbaugh et al. (2015) have hypothesized that we will see more of these "Ridiculously Resilient Ridges" and therefore Blobs in a warming climate. This is likely due to a weakening meridional temperature gradient, as the poles (particularly the North Pole) are warming faster than the tropics and midlatitudes. This creates a weaker "polar vortex" (yes, the infamous vortex you hear about on CNN) and allows strong ridges of high pressure to occur in some regions while other regions have large troughs and arctic outbreaks. When the vortex is all wavy like this, it is weak and in a "highly amplified" pattern. I know amplified = more powerful most of the time, but in this context, it refers to a lot of ridging and troughing. A strong, non-amplified polar vortex is said to be "zonal." And yes, our record breaking heat and the eastern U.S.'s record breaking cold as of late are directly related... we've had the ridge, and they've had the trough.

Thanks to the strong, potentially record-breaking El Nino, the Blob is pretty much toast, and our winter won't be as warm as last winter. I don't think we'll have 19 consecutive months of above average temperatures soon, but as we go further into the 21st century and really start to feel the effects of global warming, we'll shatter more and more heat records. Someday, air conditioning may be a standard feature for Seattle homes. That’ll probably have to do more with our rapidly growing economy than rapidly warming climate though.

On that happy note, enjoy some cooler weather. Sunday should be beautiful, but we should have typical early October weather for this time of the year this coming week. Come late October, things will start to feel a lot different. The transition to storm season is a lot more abrupt than the transition out of it!

Thanks for reading,
Charlie