Tuesday, October 6, 2015

Will Hurricane Oho Impact the Pacific Northwest?

Tuesday, October 6, 2015
3:29 pm

A tower atop Campbell Hall, Western Oregon University collapsing under the 100+ mph winds of the Columbus Day Storm. Credit: Wes Luchau, Statesman Journal

The Pacific Northwest has never gotten hit by a hurricane and never will. Our waters are simply too cold to sustain a tropical system. For a hurricane to form and keep its strength, you generally need to have 80+ degree water extending from the surface to at least 150 feet. The summer water temperatures off our coast are in the mid-50s due to the upwelling of deep, cold, nutrient-rich, acidic water (good for salmon, bad for Willapa Bay oyster larvae). But we can get the extratropical remnants of these storms, and due to the deep, tropical moisture source they provide, they can turn into quite vicious midlatitude cyclones.

The strongest of these was the Columbus Day Storm, which devastated the entire Pacific Northwest on October 12, 1962. No extratropical storm we've seen here or anywhere else in the United States can compare to the winds witnessed on that day. Not Superstorm Sandy, not the "Storm of the Century" of 1993, and certainly not the "Perfect Storm" of 1991. The map of peak gusts from the storm below speaks for itself.

Credit: Wikipedia User Spiritchaser

The Columbus Day Storm started out as Typhoon Freda, which reached category-3 status and had a minimum pressure of 948 millibars. As it traveled north, it became more entrained in the prevailing midlatitude westerly flow, and as a result, it weakened into an extratropical cyclone just before the International Date Line. As you can see, it sped up tremendously while retaining its structure. Just off the Northern California coast, it explosively redeveloped after interacting with a very strong jet stream, and the Columbus Day Storm was born (or resurrected, depending on how you see it).

The track of Typhoon Freda. The points are at 6-hour intervals, and circles represent a tropical system, while triangles delineate an extratropical one. Credit: Supportstorm

Yeah, it's fair to say I'm pretty obsessed with the Columbus Day Storm. It just kills me that I wasn't there to experience it. Nonetheless, I can't help but get excited every time there is talk of an ex-hurricane or typhoon hitting us. 

As it turns out, there is a specific tropical cyclone a little bit east of Hawaii. And the name of that tropical cyclone is Hurricane Oho.

Credit: Central Pacific Hurricane Center

Fortunately, Hurricane Oho does not appear to be a serious threat to the Pacific Northwest. This evening's model runs are forecasting a landfall near Haida Gwaii as a strong and compact extratropical storm. However, this morning's model runs showed it coming ashore Vancouver Island as a weak blob of rain. The general trend with the models has been to push Oho further westward and make it stronger, so while I doubt we will feel any effects here besides a few showers from a trailing cold front, it will be interesting to watch how this system evolves. The latest UW WRF-GFS model shows it making landfall as a 963 mb cyclone Friday morning, which is not that much weaker than the Columbus Day Storm. 

Valid 11:00 am PDT, Fri 09 Oct 2015: UW WRF-GFS

I'm not gonna lie... I'm a little bummed that Oho has its sights set on Alaska, and I don't think that will change. Still, it will be fascinating to study Oho's evolution from a tropical to an extratropical system as it races north, especially near the 53rd anniversary of the Columbus Day Storm. Stay tuned... this will be a storm to watch!

Thanks for reading,
Charlie

Monday, October 5, 2015

Historic Flooding in South Carolina

Monday, October 5, 2015
2:49 pm

Flood waters in Charleston at intersection King Street and Huger. Credit: US Army National Guard

The Pacific Northwest is no stranger to flooding. I believe that Washington has had the most federal disaster declarations of any state, which may be surprise you due to our seemingly-mundane weather. But we get these massive floods from time to time, and we also have a tendency to get strong winds, especially on the coast. We have extremely heavy snows and avalanches in the mountains as well. Our natural disasters aren't just limited to the weather... we've got earthquakes, volcanoes, and landslides too. Let's not forget about those wildfires either. When you think about it, we live in a pretty disaster-prone place, even though it might not seem like it when it rains an entire day and we've only got a tenth of an inch of liquid sunshine to show for it.

But there are times when we are reminded that no matter how hard we try, we just can't outdo some of the severe weather found in other parts of the country. And this is one of those times.

The stalled rain band over South Carolina on 16:10z October 3, 2015. Notice Hurricane Joaquin to the southeast. Credit: NASA Worldview Terra MODIS Satellite

South Carolina is just recovering from an extraordinary rainfall event, and North Carolina got hit pretty hard as well. The rainfall was primarily caused by two things: strong easterly flow due to a low pressure center over the southeast and a high pressure system way up north by Hudson Bay and convergence due to air circulating around the southeast part of the low. Converging air rises and forms clouds and precipitation, and in this case, there was a lot of convergence, and therefore a lot of rain. Additionally, once this stream of moisture went ashore and interacted with terrain, the air was forced to rise more, resulting in even heavier rainfall. This rain was NOT directly associated with Hurricane Joaquin, which was just to the southwest. However, Joaquin did provide a tropical moisture source which further contributed to the heavy rainfall. In the end, the strength of the convergence, the uplift from terrain, the stationary nature of the rainband, and the influence of nearby Hurricane Joaquin all combined to create a massive flooding event for Southern Carolina.

Rainfall accumulations across the Carolinas and surrounding states from October 1–4, ending at 6:24 p.m. EDT (22:24 UTC). Areas in white indicate accumulations in excess of 20 in (510 mm). Credit: Raleigh, NC NWS Twitter Page

The picture above shows 4-day rainfall totals from October 1-4 ending at 6:24 pm EDT on the 4th. As such, it does not represent final rainfall totals, but it represents most of what they got. The rainfall is off the charts. The chart only goes up to 16 inches, but those areas of white that you see in South Carolina represent areas where over 20 inches were estimated to have fallen! The Pacific Northwest has had very impressive rainfall totals before, but I can't remember anything like this, especially for lowland areas. For South Carolina, many locations got over 20 inches, and while this was measured over four days, the majority of the rainfall occurred over the weekend. Here are some South Carolina rainfall statistics I found on weather.com (I'm sure they got them from the National Weather Service). Amounts are in inches, and these are through October 4th.

Mount Pleasant: 26.88
Kingstree: 21.80
Dalzell: 21.66
Georgetown: 20.95
Sumter: 19.43
Summerville: 17.75
Charleston Airport: 17.29
Moncks Corner: 17.02
Charleston (Downtown): 16.29
North Myrtle Beach: 13.84
Columbia (Downtown): 11.93
Greer: 6.30

By the way, the previous state record for most rain in 24 hours was 14.80 inches, set in 1999 with Hurricane Floyd. Numerous places smashed this record.

Mt. Rainier National Park: Left pic, November 5, 2006. Right pic: same location two days later. Credit: National Park Service

Washington has had many major flood events, and I remember one back in November 2006. An incredible amount of rain fell throughout Western Washington and the Cascades from November 5 to November 7. I went to Snoqualmie Falls on November 7 - a Tuesday - and it was as muddy and high as I had ever seen it. It was something of a spiritual experience for me. Still, Seattle got 3.29 inches on the 6th, good for our 4th rainiest day ever (the rainiest day was October 20, 2003, when Sea-Tac picked up 5.02 inches of rain!). Meanwhile, Charleston got 11.50 inches of rainfall on Saturday, breaking their old record of 10.52 inches set back on September 21, 1998. We can get very wet here and have catastrophic flooding both in the mountains and very rarely in Seattle (the December 14, 2006 flood comes to mind, where a woman in Madison Valley died), but being in such a moderate climate, we tend not to see the flash flooding that South Carolina got this past weekend.


You'll see many media reports saying that this is a "once in a thousand years" flood event. I decided to take a look at this, and it turns out that while this event is unprecedented in many areas, the "once in a thousand years" might be a bit overstated. Technically speaking, "once in a thousand years" means that an event of this magnitude has a .1% chance of occurring any given year, but headlines like "South Carolina Reeling From ".1% Chance Of This Bad Of A Flood Occurring Any Given Year" Flood" just don't, well, make that much money.

There's also talk of climate change, but keep in mind that heavy rainfall events have always happened and always will. There is evidence that heavy rain events will increase in severity (for example, more "Pineapple Express" flooding events are expected here in the Pacific Northwest in a warming climate), but it is far from conclusive. Besides, the global warming signal is fairly weak throughout the globe right now with the exception of the far northern latitudes. Long story short... let's talk about the "new normal" in 2100, when our climate will be significantly different from what it is today. The climate is not much different today than it was 20 years ago.

Historic rainfall in SC -- only happens once every 100-200 years. Credit: https://twitter.com/NWSRaleigh

The National Weather Service compiled a neat little graphic showing the return period of events like these, and it looks like it's more of a 100 to 200-year event for most places. There are some places where it looks to be off the charts and that the "1000-year event" label is justified, but these places look few and far between. The media can be very misleading... don't let it fool you!

Enjoy the nice weather here! We'll have a couple weak systems coming through this week, but nothing major. However, I don't think it's misleading to say that storm season is right around the corner!

Thanks for reading,
Charlie

Friday, October 2, 2015

Another Heat Record Bites The Dust/Thoughts on The Blob

Thursday, October 1, 2015
4:08 p.m.

"It ain't the heat, it's the humility" - the late, great Yogi Berra

At Sea-Tac, the last time we had a month that was cooler than average for that month was February 2014. Since then, 20 months have passed, with 19 consecutive months being warmer than normal. That's right... this September was the first colder than normal month since February 2014.

We've broken some impressive records in that time. Our records to Sea-Tac go back to January 1948, but within the span of these months, we've broken two all-time records for hottest months (March 2015 and June 2015). In addition, December 2014 and June and July 2015 broke records for all-time highest maximum temperature, and October 2014 and February, March, June, and July 2015 broke record for all-time highest minimum temperature. In other words, these 19 months weren't just warm, they were scorching!

Why so warm?

Two answers: a massive and persistent ridge of high pressure, and a larger-than-life blob of boiling-hot (OK, maybe not that hot, 2-3 degrees warmer than normal) water in the Northeast Pacific. With this ridge, instead of getting cool, northwesterly flow from the Gulf of Alaska and places to the Northwest, we got warmer flow originating from our south, and our surface winds were often offshore, further warming us due to downslope adiabatic warming effects off the Cascades (that's fancy terminology for the phenomenon of air warming as it sinks). With the warm water, onshore flow off the Pacific into our region was often at least 2 degrees higher than it would have been due to the long time it spent over the Blob of warm water. 

The picture above shows our sea-level-pressure compared to normal values, and you can clearly see that we had higher than normal pressure this summer. As you can see, we clearly had higher than normal pressure over the Northeast Pacific this year.
This ridge of high pressure was associated with relatively little mixing of the ocean, so the surface got nice and warm instead of having this warmth being mixed down deep by storms and waves. Also, these ridges are associated with sunny skies, so the sun heated the ocean.

I was unable to find out how to get a similar chart to this for sea surface temperature (SST), but as you can see from the February-March 2015 SST anomaly chart below, the "Blob" is located in the same area that the higher-than-normal pressure is located. This is not a coincidence! The Blob is a direct result of this higher-than-normal pressure.

As you can see below, the Blob wasn't just present in 2015. It was there in 2014 too; in fact, that is when it was first named. It was a bit further west, and a bit more "blob-like" then (at least in my opinion).

Credit: NOAA Earth Systems Research Laboratory: Physical Science Division

So, why did this persistent ridge of high pressure (and the resulting Blob) occur? There's been a lot of study concerning it, particularly at the University of Washington, where Professor Nick Bond (great guy, had him for my senior capstone forecasting course spring quarter) first came up with the "Blob" name. It turns out that the high pressure looks to have originated from atmospheric waves originating from the western Pacific. On a larger time scale, the Pacific Decadal Oscillation, an oscillation in Pacific Ocean temperatures on 20-30 year time scales that has atmospheric implications, may be a factor. Finally, some studies like those by Diffenbaugh et al. (2015) have hypothesized that we will see more of these "Ridiculously Resilient Ridges" and therefore Blobs in a warming climate. This is likely due to a weakening meridional temperature gradient, as the poles (particularly the North Pole) are warming faster than the tropics and midlatitudes. This creates a weaker "polar vortex" (yes, the infamous vortex you hear about on CNN) and allows strong ridges of high pressure to occur in some regions while other regions have large troughs and arctic outbreaks. When the vortex is all wavy like this, it is weak and in a "highly amplified" pattern. I know amplified = more powerful most of the time, but in this context, it refers to a lot of ridging and troughing. A strong, non-amplified polar vortex is said to be "zonal." And yes, our record breaking heat and the eastern U.S.'s record breaking cold as of late are directly related... we've had the ridge, and they've had the trough.

Thanks to the strong, potentially record-breaking El Nino, the Blob is pretty much toast, and our winter won't be as warm as last winter. I don't think we'll have 19 consecutive months of above average temperatures soon, but as we go further into the 21st century and really start to feel the effects of global warming, we'll shatter more and more heat records. Someday, air conditioning may be a standard feature for Seattle homes. That’ll probably have to do more with our rapidly growing economy than rapidly warming climate though.

On that happy note, enjoy some cooler weather. Sunday should be beautiful, but we should have typical early October weather for this time of the year this coming week. Come late October, things will start to feel a lot different. The transition to storm season is a lot more abrupt than the transition out of it!

Thanks for reading,
Charlie

Sunday, September 27, 2015

A Supermoon Lunar Eclipse!

Sunday, September 27, 2015
6:03 pm

Credit: NASA

We've all heard of supermoons... after all, we've had three of them this year. The same goes for lunar eclipses... we had one this past April. They are both fascinating events.

But what if you were to combine the largest supermoon of the year with a total lunar eclipse?

I had known about this for several weeks, but realized the true scope of the supermoon last night as I was heading towards a gig with my funk band up in the University District. As I walked along the Ave, I noticed a massive moon up in the sky. I could not ever remember seeing a bigger and brighter moon. It turns out that it is going to be even bigger tonight, and blood-red as well. 

Credit: Courtney Seligman

Lunar eclipses happen when the Earth is positioned in front of the sun such that it blocks the moon from receiving direct sunlight. Instead, the moon is positioned in the "umbra" of the Earth, meaning is fully shadowed from the sun. However, it doesn't appear black (and hence invisible) because light from the sun scatters off the Earth's atmosphere and hits the moon, giving it a reddish tint.

"Supermoons" occur because the moon has an elliptical orbit, meaning that it is closer to the Earth at some times during its 27-day orbit than others. When one of these close points corresponds with a full moon, you get a supermoon!

To get both of these occurring at once is exceedingly rare. The last supermoon lunar eclipse occurred in 1982, and the next one will occur in 2033. So enjoy tonight!

Luckily for us, the viewing conditions for tonight will be absolutely perfect. The air quality is great, the air is relatively dry, and there are no clouds in the sky to muck up viewing of this historical event. The model picture below measures outgoing longwave (infrared) radiation and simulates an infrared satellite image. As you can see, there are NO clouds over our region. Pretty awesome!

Valid 08:00 pm PDT, Sun 27 Sep 2015 - 15hr Fcst: Retrieved from UW Modeling Website

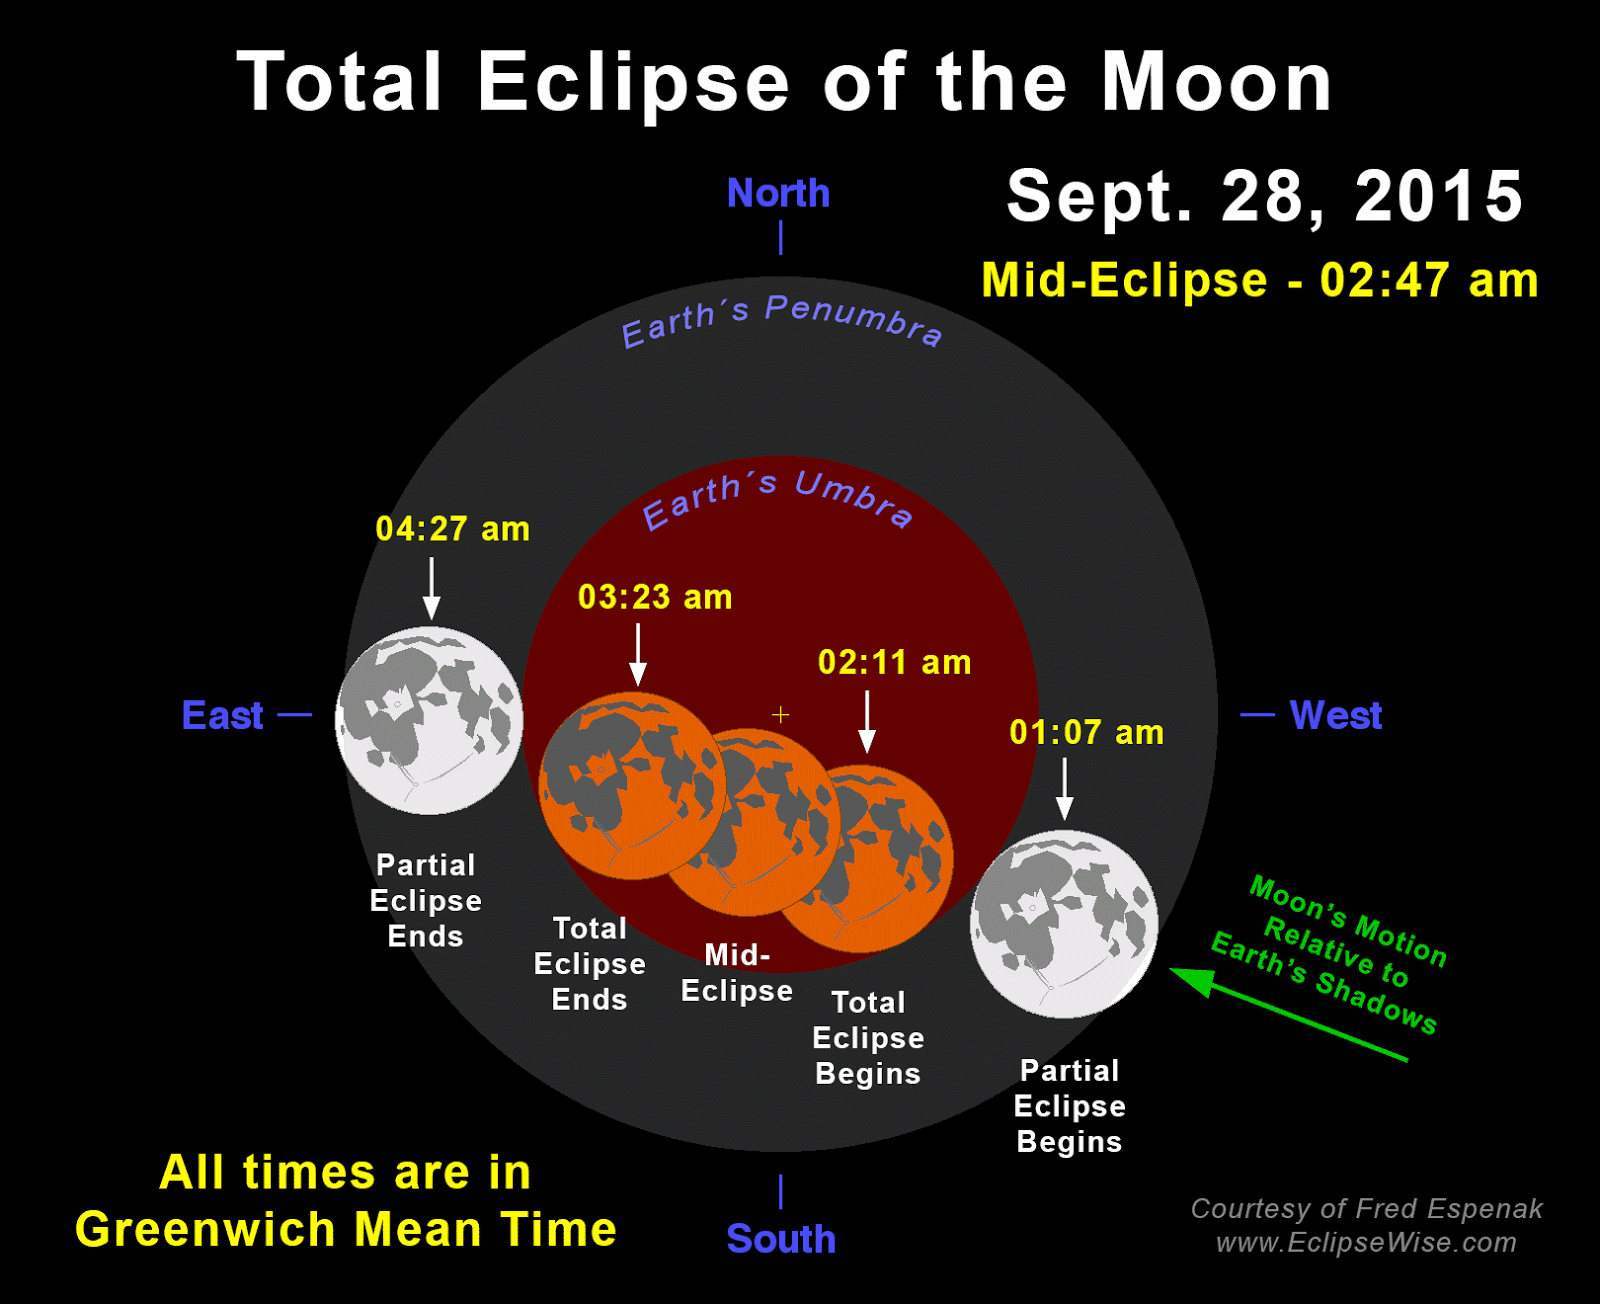
The partial eclipse is now underway, and the total eclipse will be here within a half hour. We're lucky... if the eclipse was a little sooner, it would still be light out and would not be nearly as stunning. The times below are in Greenwich Mean Time, so just subtract 8 hours to get PDT. For example, the full lunar eclipse starts at 7:11 pm and ends at 8:23 pm.

Credit: www.eclipsewise.com

Enjoy this unique phenomenon, and take some pictures! I know I will!

Charlie

Thursday, September 17, 2015

A Megathrust Earthquake And Tsunami off Chile!

Thursday, September 17, 2015
1:24 p.m.

The port town of Coquimbo, Chile after the earthquake and tsunami. Credit: Wikimedia User Sfs90

Chile is hands-down the most active place in the world when it comes to megathrust earthquakes. Three of the past six megathrust (subduction zone earthquakes over moment magnitude 8) earthquakes have been in Chile, and one of those three that was not in Chile was in Peru (the others were the 2004 Indian Ocean Earthquake/Tsunami and the 2011 Japan Earthquake/Tsunami). Heck, they had an 8.2 earthquake just last year, and a 8.8 earthquake back in 2011. Here in Cascadia, we are frightened (and rightfully so) about a mega-quake that occurs once every 200-700 years. But Chile's gotten three magnitude 8+ of those quakes since 2001! We haven't had one of those quakes since 1700.

Their most recent quake struck 29 miles west of the Chilean city of Illapel. This is a very seismologically active region even for Chile; 15 7+ magnitude earthquakes had struck with 400km of this area within the last century prior to yesterday's earthquake. It was an 8.3 earthquake, so while it was powerful, it was not the same magnitude as the aforementioned Japan or Indian Ocean earthquakes. The moment magnitude scale is a logarithmic scale, meaning that the energy released by an earthquake increases exponentially with linearly increasing magnitude. For example, a magnitude 9 earthquake is not three times as powerful as a magnitude 3 earthquake... it is a billion times more powerful! If you ever want to compare earthquake magnitudes, the ratio between the energy released due to earthquake 1 and earthquake 2 = 103/2(Magnitude of Earthquake 1 - Magnitude of Earthquake 2). Nothing wrong with a little math to keep your brain nice and fresh! Using that calculation, it was about 11 times less powerful than the 9.0 2011 earthquake of the Pacific coast of Japan, so while it wasn't as powerful as some of the powerful quakes of years past, it was still pretty darn powerful... nearly 6 times more powerful than the catastrophic Nepal earthquake we saw earlier this year.

Source: Environmental Physical Geography

Just like all of the other Chilean megathrust earthquakes, this earthquake was formed by the subduction of the Nazca Plate under the South American Plate. As this subduction occurs, certain places become "locked" due to friction and can no longer undergo the subduction process. Below this locked zone, however, warmer temperatures make the plates less rigid, allowing them to continue to slide past each other. As this occurs, stress builds up along the locked zone, and when the stress exceeds a certain threshold, all of the energy is released and a massive earthquake ensues, often accompanied by a tsunami.

Source: Cascadia Region Earthquake Workgroup

The reason why Chile gets so many of these violent earthquakes is because the rate at which the South American Plate is subducting the Nazca Plate. The faster the rate of subduction, the more stress builds up in a certain amount of time, and the more frequent the earthquakes. The South American Plate is moving westward at 10 cm/year, and the Nazca Plate is moving eastward at 15-17 cm/yr, giving an approximate subduction rate of 26 cm/yr (Monroe & Wicander, 2006). In comparison, the Cascadia fault has an approximate subduction rate of 4 cm/yr (Cascadia Region Earthquake Workgroup, 2013). 

Now, let's move on to the actual earthquake at hand!

Source: USGS Earthquake Hazards Program

The USGS map above shows the Mercalli intensity Scale, which is a qualitative measurement and measures the intensity of the earthquake, unlike the moment magnitude scale which is a quantitative measurement and measures the total energy released. The intensity of an earthquake is dependent on many factors and can vary substantially from one region to another, but one of the biggest things that it is dependent on is the depth of the earthquake. If you have a 8.0 earthquake 600 miles deep, there will be no damage. However, if you have an 8.0 earthquake right at the surface, the damage will be catastrophic. With a depth of 15 miles, this earthquake was comparable to depth to other recent megathrust quakes.

As you can see, strong to severe shaking was reported over a very large area. Even in Buenos Aires, some 690 miles away from the epicenter, buildings swayed and car alarms were spontaneously set off. People even reported shaking in São Paulo 2,100 miles away. That's the same distance as New Orleans is from Seattle!

And let's not forget about the tsunami.

Boats stranded in Coquimbo after the tsunami. Credit: Wikimedia User Sfs90

Due to this "only" being a magnitude 8.3 earthquake, it did not have the massive tsunamis that the Japan and Indian Ocean earthquakes had. However, it still sent a 15-foot wave to Coquimbo, stranding boats and flooding parts of port city. Over a million people have been ordered to leave their homes in Chile due to the tsunami and earthquake, and hundreds of thousands around the Pacific have been ordered to evacuate. A tsunami advisory was actually posted by the National Weather Service for Southern California for waves less than one foot in height, but it was later cancelled.

The National Tsunami Warning Center issues these awesome "propagation forecasts" after these earthquakes occur. Look at how the energy is not distributed evenly; there are little filaments of higher wave energy scattered within the overall wave dispersion. You may see the low wave height values and say to yourself: "I thought this wave was one foot when it hit L.A. Why does the map show it as less than five centimeters?" Well, the answer is that this map shows the height of the tsunami as it travels through the open water at 500 mph. As the waves approach the shore, they slow down considerably and increase dramatically in height.

Source: National Tsunami Warning Center
The physics of tsunami propagation. Credit: Régis Lachaume

One of my favorite things to do after these events is look at tide gauges. Even though it is very unlikely that anybody in southern California observed the tsunami, the tide gauges definitely reported it. Let's take a look at some! By the way, all these charts (and many more) can be found at NOAA's Tides & Currents website.


Santa Monica reported a 0.7 wave. But how about some other locations around the U.S.?


Hilo Bay, much more exposed to the tsunami, saw a 5'11" drop in sea level today as the waves raced 455 mph across the ocean. Impressive. 


Even the Washington coast saw some action! Take a look at La Push. You can clearly see fluctuations in water level from the tsunami occurring this afternoon.

Of course all of this pales in comparison to Coquimbo. 


One thing to take away from all these gauges is that the first wave often isn't the strongest, you don't always experience the ocean receding before the first wave, and tsunamis can last for hours. If you live in a tsunami-prone zone, as soon as you feel shaking, evacuate to high ground, and stay there! Even if you don't feel shaking, it's always important to be aware of any tsunami advisories or warnings, as earthquakes thousands of miles away can still send devastating tsunamis into certain locales where the sea floor amplifies incoming waves. Crescent City, a coastal city situated in Northern California, was devastated by a deadly 20 foot tsunami due to the Good Friday Earthquake of 1964. Even the 2011 Japan earthquake sent an 8 foot tsunami to the harbor, killing one person.

At some point, we will get a megathrust earthquake off our coast. It might be five seconds from now, and it might be 500 years from now, when the world is 900 degrees and we all have the same color hair. But it's crucial that we prepare by rebuilding our infrastructure and having better disaster management/evacuation strategies, because the longer we put off dealing with those things, the bigger a hole we are digging ourselves in the future.

On that note, have a nice evening!
Charlie