Saturday, September 17, 2011 7:30 P.M.
It looks as if the rain has spread in much earlier than I anticipated, so I am shifting rain totals higher amounts (up to a half inch in the lowlands) and am expecting the rain to stop and shift to showers Sunday morning. I guess the model I looked at did not have a good grip on this storm! I guess I'll have to get used to that too... another part of winter in the Pacific Northwest.
Charlie
Saturday, September 17, 2011
First "major" storm of the year
Saturday, September 17, 2011
10:56 A.M.

Ladies and gentlemen, it appears that our first "major" storm of the year is upon us. I say "major" because it will likely be the biggest storm we have seen in months. However, I put quotes around it because in all honesty, it is a pretty weak storm. However, remember how I was talking about that pattern change and that strong jet stream? Although most of the storm is heading up north, the jet stream has helped the cyclone deepen, and we will see some fringe effects of it.
One thing that stands out is that you can see three clear fronts. The cold front is in the far left, and it is trailing the storm. The warm front is to the far right, and it is already spreading some clouds over the area. The occluded front is to the north, and it is bent back in a counter-clockwise direction to the center of the low. For more information on the different types of fronts, refer to my previous blog post.

The above model frame, taken from the WRF-GFS model in 36km resolution, shows the current precipitation associated with this storm, as well as the isobars. Isobars show lines of constant pressure, and can be thought of as a "topographical map" of pressure at the surface.

We are getting drizzle right now, but the storm will really start to affect the interior early Sunday morning. The Olympics will get the heaviest rain, but the lowlands will likely also get some significant rain for this time of year. Nothing too drastic, but more than we have seen in a while. I'm forecasting amounts up to 1.5 inches on the Olympics with most places getting less, and rainfall amounts around a quarter of an inch or less in the lowlands, with more precipitation the further north you go.
I was looking at the extended run of the WRF-GFS, and I saw something that could be a little troublesome.

10:56 A.M.

9/17/11 10:45 A.M. PDT infrared satellite (taken from UW atmos website)
Ladies and gentlemen, it appears that our first "major" storm of the year is upon us. I say "major" because it will likely be the biggest storm we have seen in months. However, I put quotes around it because in all honesty, it is a pretty weak storm. However, remember how I was talking about that pattern change and that strong jet stream? Although most of the storm is heading up north, the jet stream has helped the cyclone deepen, and we will see some fringe effects of it.
One thing that stands out is that you can see three clear fronts. The cold front is in the far left, and it is trailing the storm. The warm front is to the far right, and it is already spreading some clouds over the area. The occluded front is to the north, and it is bent back in a counter-clockwise direction to the center of the low. For more information on the different types of fronts, refer to my previous blog post.

Valid 11:00 am PDT Sat, 17 Sep 2011 - UW 12z 36km WRF-GFS 3 hour precipitation

Valid 05:00 am PDT Sun, 18 Sep 2011 - UW 36km 12z WRF-GFS 3 hour precipitation
We are getting drizzle right now, but the storm will really start to affect the interior early Sunday morning. The Olympics will get the heaviest rain, but the lowlands will likely also get some significant rain for this time of year. Nothing too drastic, but more than we have seen in a while. I'm forecasting amounts up to 1.5 inches on the Olympics with most places getting less, and rainfall amounts around a quarter of an inch or less in the lowlands, with more precipitation the further north you go.
I was looking at the extended run of the WRF-GFS, and I saw something that could be a little troublesome.

Valid 11:00 am PDT Wed, 21 Sep 2011 - 102hr Fcst - UW 36km 12z WRF-GFS 3 hour precipitation


My eye immediately jumped not to the storm affecting British Columbia and Alaska (which is significantly stronger than tomorrow's storm but will not impact us) but to the wave by 40 degrees north and 160 degrees west. After watching these models for years, I've become able to recognize waves that look like they might have potential to develop into strong storms.
Below is the same wave 15 hours later.

Valid 02:00 am PDT Thu, 22 Sep 2011 - 117hr Fcst - UW 36km 12z WRF-GFS 3 hour precipitation
But look at the storm it develops into 18 hours later!

Valid 08:00 pm PDT Thu, 22 Sep 2011 - 135hr Fcst - UW 36km 12z WRF-GFS 3 hour precipitation
That is a very powerful storm for September! A little further south and we would be talking about a major windstorm. And when I say major this time, I really mean it.
But I started to get concerned after the following frames. Here is the storm 12 hours later.

Valid 08:00 am PDT Fri, 23 Sep 2011 - 147hr Fcst - UW 36km 12z WRF-GFS 3 hour precipitation
You can the cold front "training" into the Olympic Mountains. This setup is called a "Pineapple Express," because it often stretches back toward Hawaii and brings gobs of saturated, subtropical air into our area. To make matters worse, these types of storms often stall over the area and don't move from side to side much. This is a classic setup for major flooding in the Pacific Northwest. Right now, the front is mainly to our north and only dips down for a small period of time, which would give the mountains heavy rain but would confine Vancouver Island to flooding. Also, this forecast is far in advance.
Bottom line: this scenario is too far out to make any conclusions, and honestly, it probably will not develop. But it is something to keep an eye out for. I have already warned my cousins who live on the Snoqualmie River, because if this scenario plays out and the front stalls over central Washington, some of our rivers could flood.
Regardless, it is interesting to see a storm this powerful this early in the season. Then again, the most powerful windstorm on record, the Columbus Day Storm, was also the earliest major windstorm, striking the Pacific Northwest on October 12, 1962.
The storm season is upon us!
Charlie
Friday, September 16, 2011
Tropical vs. Extratropical Cyclones
Thursday, September 15, 2011
4:05 P.M.
I'm doing what would be Friday's post today since I will hiking around Mt. Rainier tomorrow.
We are now right at or just past the peak of hurricane season, and in a month or so, we should start seeing a more consistent flow of extratropical storms across the Pacific, and they will really ramp up in November. Hurricanes and extratropical cyclones may seem similar at face value; they both cause rain and wind. However, that's about where the similarities end. The more I have learned about these two types of storms over the years, the more I have marveled about how two completely different sets of circumstances can produce extremely powerful storms.

Hurricanes derive their energy from heat and moisture. There are three main ingredients needed for tropical storm formation: warm SSTs over 80 degrees Fahrenheit, ample moisture, and an area of convergence. Most of the tropical cyclones in the Atlantic start out as thunderstorms in the Intertropical Convergence Zone (ITCZ). The ITCZ, known by sailors as the Doldrums, is the area where the trade winds from the northern and southern hemispheres meet. If a sailor wandered too close to the equator, they often got stuck in the Doldrums. The Doldrums are hot, humid, and calm. Many sailors who got stuck in the Doldrums ended up starving because they could not get catch any wind. Crossing the equator was a risky move for sailors and explorers, and not everybody made it.
The warm SSTs, the hot/humid air, and the low wind shear in all levels of the atmosphere make the ITCZ a prime spot for tropical cyclone formation. When enough thunderstorms develop, a local area of low pressure is formed from the convection that the storms produce. Winds rush to the area of lower pressure and rise, creating more thunderstorms, more convection, and even lower pressure, as more air rises upward from the center rather than filling it in. Additionally, when water turns from invisible water vapor gas to visible cloud droplets, latent heat is released because of condensation, which gives the storm even more energy. If conditions are favorable, this cycle strengthens and a tropical storm (sustained winds 39-73 mph) is born. At some point, the Coriolis Effect, which causes things to deflect to the right, becomes more noticeable, and a center of circulation develops. If the storm continues to strengthen, it will become a hurricane and the center of circulation will be clearly visible. This is called the "eye" of the storm. Even though the eye is where the lowest pressures are found, the winds are calm and there are often sunny skies. Remember, winds are created by differences in air pressure, not simply low pressure itself.
As long as a hurricane has warm water, humid air, and low wind shear, it will generally keep its strength or strengthen. Some hurricanes can last for weeks. A hurricane will die out when wind shear rips it apart, when it runs into dry air, or when the energy source (warm water) is cut off. That is why hurricanes die out so quickly when they reach land. They no longer have access to the warm water that gives them energy.
As you can see from the picture of Hurricane Katrina above, strong hurricanes are very symmetrical, especially when there is low wind shear in the upper atmosphere. The eye wall surrounds the eye, and this is where the heaviest rain and strongest winds are found. Out from that, higher rain clouds give moderate amounts of precipitation, with heavy amounts of precipitation found in individual rain bands. Tropical systems can generate enormous amounts of rain. In fact, Alvin, Texas, received 43 inches of rain in 24 hours when Tropical Storm Claudette stalled over the region, setting a U.S. record that has yet to be broken.
The below diagrams show the formation of the thunderstorms required for tropical systems and the basic anatomy of a hurricane. I got both of these from an MIT page.


Now, I'll talk about extratropical cyclones.

4:05 P.M.
I'm doing what would be Friday's post today since I will hiking around Mt. Rainier tomorrow.
We are now right at or just past the peak of hurricane season, and in a month or so, we should start seeing a more consistent flow of extratropical storms across the Pacific, and they will really ramp up in November. Hurricanes and extratropical cyclones may seem similar at face value; they both cause rain and wind. However, that's about where the similarities end. The more I have learned about these two types of storms over the years, the more I have marveled about how two completely different sets of circumstances can produce extremely powerful storms.
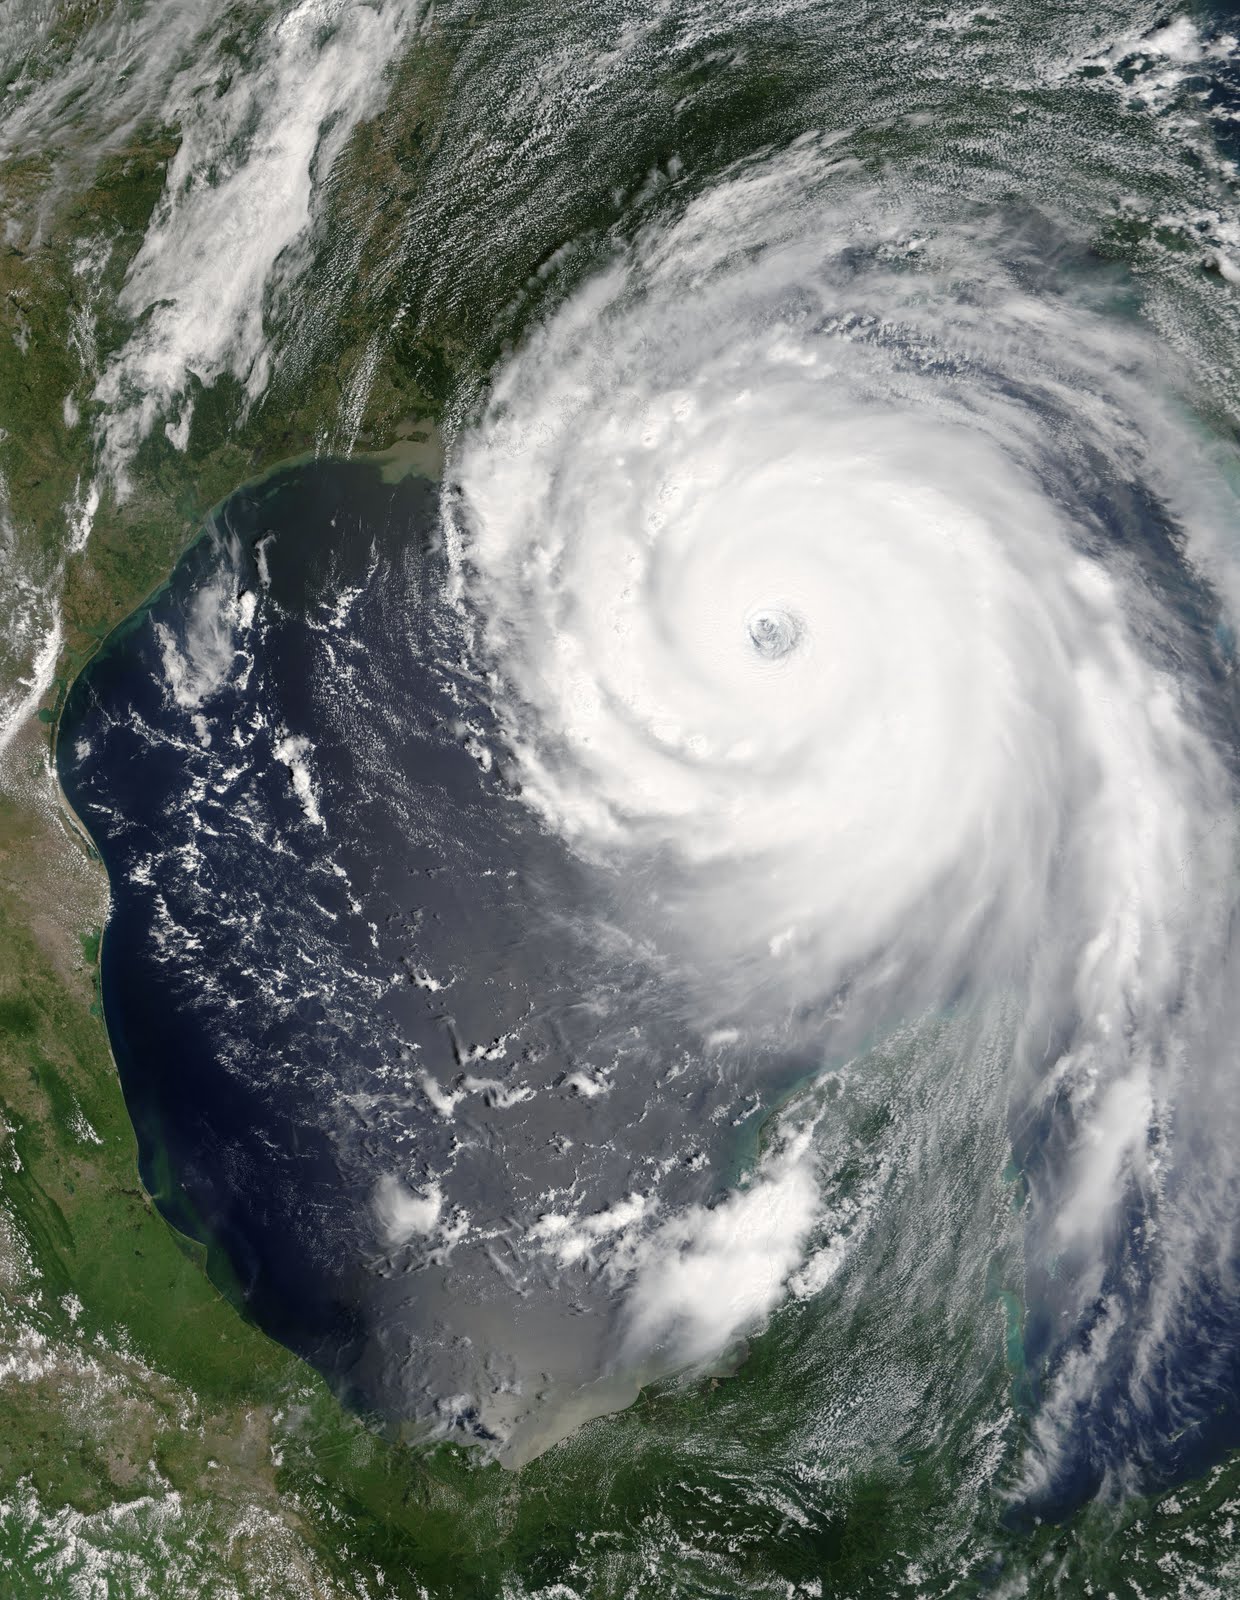
Hurricane Katrina, 8/28/05. Author: Jeff Schmaltz, MODIS Rapid Response Team, NASA/GSFC
Hurricanes derive their energy from heat and moisture. There are three main ingredients needed for tropical storm formation: warm SSTs over 80 degrees Fahrenheit, ample moisture, and an area of convergence. Most of the tropical cyclones in the Atlantic start out as thunderstorms in the Intertropical Convergence Zone (ITCZ). The ITCZ, known by sailors as the Doldrums, is the area where the trade winds from the northern and southern hemispheres meet. If a sailor wandered too close to the equator, they often got stuck in the Doldrums. The Doldrums are hot, humid, and calm. Many sailors who got stuck in the Doldrums ended up starving because they could not get catch any wind. Crossing the equator was a risky move for sailors and explorers, and not everybody made it.
The warm SSTs, the hot/humid air, and the low wind shear in all levels of the atmosphere make the ITCZ a prime spot for tropical cyclone formation. When enough thunderstorms develop, a local area of low pressure is formed from the convection that the storms produce. Winds rush to the area of lower pressure and rise, creating more thunderstorms, more convection, and even lower pressure, as more air rises upward from the center rather than filling it in. Additionally, when water turns from invisible water vapor gas to visible cloud droplets, latent heat is released because of condensation, which gives the storm even more energy. If conditions are favorable, this cycle strengthens and a tropical storm (sustained winds 39-73 mph) is born. At some point, the Coriolis Effect, which causes things to deflect to the right, becomes more noticeable, and a center of circulation develops. If the storm continues to strengthen, it will become a hurricane and the center of circulation will be clearly visible. This is called the "eye" of the storm. Even though the eye is where the lowest pressures are found, the winds are calm and there are often sunny skies. Remember, winds are created by differences in air pressure, not simply low pressure itself.
As long as a hurricane has warm water, humid air, and low wind shear, it will generally keep its strength or strengthen. Some hurricanes can last for weeks. A hurricane will die out when wind shear rips it apart, when it runs into dry air, or when the energy source (warm water) is cut off. That is why hurricanes die out so quickly when they reach land. They no longer have access to the warm water that gives them energy.
As you can see from the picture of Hurricane Katrina above, strong hurricanes are very symmetrical, especially when there is low wind shear in the upper atmosphere. The eye wall surrounds the eye, and this is where the heaviest rain and strongest winds are found. Out from that, higher rain clouds give moderate amounts of precipitation, with heavy amounts of precipitation found in individual rain bands. Tropical systems can generate enormous amounts of rain. In fact, Alvin, Texas, received 43 inches of rain in 24 hours when Tropical Storm Claudette stalled over the region, setting a U.S. record that has yet to be broken.
The below diagrams show the formation of the thunderstorms required for tropical systems and the basic anatomy of a hurricane. I got both of these from an MIT page.

Storm formation

Hurricane anatomy
Now, I'll talk about extratropical cyclones.

Infrared Satellite picture 12/14/06 @ 6 P.M. PST, courtesy of US Naval Research Labortory
The above photo is an infrared satellite picture of the Hanukkah Eve Storm of 2006, the most recent major windstorm to affect Seattle and places east of the Washington and Oregon coasts. This storm was the most powerful one since the Inauguration Day Storm of 1993, and the most damaging since the Columbus Day Storm of 1962. For more information on this storm, ask me or check out The Storm King website under "My Favorite Weather Links" on the right side of this blog.
While tropical cyclones get energy from a homogenous, hot, and humid air mass, extratropical storms get their energy from a boundary, or front, between two different air masses. There are three main stages that extratropical cyclones go through.

The first stage is what is called an open wave. A storm starts off with a stationary front dividing warm air from the south and cold air from the north. Because of the Coriolis Effect, cold air will push south and warm air will push north, creating a center of rotation with fronts that spin counter-clockwise in the Northern Hemisphere, and clockwise in the Southern Hemisphere.
The second stage is a fully developed cyclone. The counter-clockwise rotation that began with the open wave strengthens and the pressure begins to drop. Also, since cold fronts tend to move faster than warm fronts, the storm takes on less of a horizontal appearance and begins to make the familiar common shape that we often see with these types of storms. As warm air from the south is sucked into the center of the storm, it rises, expands, condenses, and cools, while releasing latent heat from the condensation of water droplets in the process. At this stage of the cyclone, there is more air being sucked up than air filling the low pressure center at the surface. Because of this process, additional air molecules are being expelled, creating lower atmospheric pressure throughout the mid and lower levels of the storm.
The third stage is the occluded cyclone. Remember how I said that cold fronts move faster than warm fronts? Eventually, the cold front catches up and overtakes the warm front. This creates a new type of front - an occluded front. Occluded fronts share the characteristics of both warm and cold fronts. This is most intense stage of the cyclone, but sometime into this stage, the cyclone begins to weaken. This is because the air masses on either side of the occluded front are similar in temperature and humidity, and since extratropical storms get their energy from different air masses along a front, they are cut off from their energy source and slowly weaken.
A storm can get especially strong when it is fed by a strong jet stream. Strong jet streams often form amongst stark differences in tropical and polar air masses, meaning that there is a lot of potential energy stored. As previously stated, cyclones deepen when warm air rises into colder air, with more air rising from the center than rushing to it. Additionally, a strong jet stream will speed up this process. Warm air will converge at the center at a faster rate, and the cooled air aloft will diverge faster, making way for new air to fill the void.
The result can be a huge storm with winds that can sometimes approach category 3 hurricane speeds. In addition, these storms are much, much larger and usually move much faster. The Columbus Day Storm of 1962 created hurricane-force winds from California to Vancouver Island, and some storms have stretched from the Pacific Northwest all the way to the International Date Line!
As you can see, these two types of storms are very different! There are a lot of minor details, particularly with extratropical storm formation, which is considerably more complex than tropical storm formation (at least it's harder for me to explain). Upper level winds fuel a mid-latitude cyclone but can tear a tropical one apart. Extratropical storms usually disintegrate after a couple days due to an occlusion, but tropical storms can exist for a much longer time. And the biggest difference of course, is that tropical cyclones have no fronts. They get their energy from warm air. Extratropical cyclones start because two air masses come together and form a front.
That was a really long post, if you have any questions, comment below and I will be sure to answer them.
Thank you for reading!
Charlie
Thursday, September 15, 2011
Double-Dip La Nina!
Thursday, September 15, 2011
10:08 A.M.

10:08 A.M.

Sea Surface Temperatures at different points in the Equatorial Pacific on week centered around 9/7/11
The above picture is from NOAA's CPC (Climate Prediction Center). As you can see, there has been a clear trend as of late for a cooling of the SST (Sea Surface Temperatures) in the Equatorial Pacific. This trend is also reflected at deeper depths. Last year, we saw one of the largest La Nina events on record, but we transitioned to a neutral pattern after that. However, around August, there was a strengthening of the trade winds, resulting in increased upwelling in the Eastern Tropical Pacific. When you have upwelling, you have cooler SSTs because the water at the surface is being continually replaced by deeper, cooler water. That is why the the water off of Los Angeles is generally 20-30 degrees cooler than the water in the Gulf of Mexico in the summer. Upwelling is strongest closer to shore, so when I go tuna fishing off of the Washington coast, I have to go around 50 miles out to get to warmer, bluer water, as upwelling also increases nutrients toward the surface. In fact, the ancient Peruvians knew an El Nino was coming when the fishing off of their coast became poor. There was a decrease in upwelling, resulting in less nutrients and less fish.
But enough about fishing. Let's talk about weather. If you take a look below, you will see a bunch of models showing their predicted SST anomalies for the Nino 3.4 region, which is usually regarded as the most reliable region for telling if a El Nino/La Nina event is forecast or occurring.
Dynamical and Statistical 3.4 SST anomalies from the International Research Institute for Climate and Society Updated 8/17/11
I looked all over for a more present chart, but this is all I could find, and I took it off of Cliff Mass' blog. Thanks Professor Mass!
As you can see, the models are all over the place. However, the NCEP CFS model clearly shows La Nina conditions, and this model is generally regarded as the most accurate.
The models, along with decreasing SSTs and a historical tendency for weaker La Ninas to follow major events, have prompted NOAA to raise their previous La Nina Watch to a La Nina Advisory. Basically, this means that they are now forecasting La Nina conditions for the coming winter, whereas before they were uncertain.
Most of you know what a La Nina means for us; we will have cooler than average temperatures and above average precipitation this year, most pronounced after January 2012. We will also have a higher probability of above average snowfall in the mountains and in the lowlands. I don't know if they have snow days in college, but I'm hoping they do. And for those still in grade school, you may get an unexpected day off or two this winter.
For current La Nina conditions, check out the "Tropical Pacific SST" link I have on the right side of this blog. Or, you can go here: http://www.cpc.ncep.noaa.gov/products/analysis_monitoring/enso_update/sstanim.shtml
You stay classy, planet Earth.
Charlie
Wednesday, September 14, 2011
Pattern Change!
Wednesday, September 14, 2011
6:38 P.M.
Hi everybody! I slacked off on writing my weather blog this summer, but now I am back and I will resume a regular schedule. Thank you Nicholas Efthimiadis for the friendly reminder to stop being so lazy! In all honesty though, there wasn't much to write home about this summer. I absolutely LOVED the weather this summer, don't get me wrong, but from a meteorological standpoint, it was pretty boring in the Pacific Northwest.
But there is change in the air. As you have no doubt noticed, things have cooled down quite a bit over the last few days. This is because we have switched from an offshore flow to an onshore flow. During the summer, the Pacific is cooler than the land of the Pacific Northwest, and during the winter, it is warmer. No matter what time of year it is, an onshore flow helps moderate the temperature, making sure it doesn't get too hot or too cold. Except for Pineapple Express events in the winter, nearly all of our daily record highs and lows come in a pattern with offshore flow.

12z 9/14/11 36km WRF-GFS
The above graphic shows what the 1000-500mb thickness was like this morning. If you don't know what that means, search it on this blog, I have talked about it before. Basically it measures the overall warmth of the lower atmosphere. You can see that a thermal trough has pushed to the east of our area. A thermal trough is a local area of low pressure that is created by hot air rising and creating a area of low pressure. It is not associated with rain; in fact, our hottest days on record are the result of thermal troughs.
However, since this thermal trough has pushed eastward, we are now getting strong onshore flow from the Pacific, since air flows from high pressure to low pressure. That is why we have been cloudy and cool as of late.
And as we near October, we should start seeing a strengthening of the jet stream in the Eastern Pacific and a more active storm track as a result. In fact, look at the jet stream right now...

12z 9/14/11 36km WRF-GFS
... and the jet stream five days from now!

12z 9/14/11 36km WRF-GFS
That is a monumental change in the upper atmosphere! However, we will not feel the effects as much here in the lowlands since the jet stream is still to our north. But be warned, change is on the way!
We will see mostly cloudy skies throughout the next seven days with showers Saturday through Monday. Starting Tuesday, we might get into the low 70s, but I think you'll have to wait until next year to get back into the 80s.
Tomorrow I'll talk about our "Double-Dip" La Nina! Who's ready for round two?
Thanks for reading,
Charlie
Subscribe to:
Posts (Atom)