Thursday, April 7, 2016

Record Heat Today?

Frying an egg and two strips of bacon on the side of the road in Death Valley, California.
Credit: www.catholic.org

What a change a month makes! Back on the 10th and 13th of March, we had two powerful windstorms roll through the area, with the one on the 10th causing lots of damage to the Northern Interior and creating a lot of coastal flooding and the one on the 13th making my last day of teaching ski lessons to kindergartners up at Alpental an adventure for the ages. Now, here we are, less than a month later, and we're expected to hit the 80s throughout the area today. Springtime isn't known for dramatic shifts in weather, but we can get these big ridges of high pressure that bring us exceptionally warm days, and after all the rain we've had, the change has never felt so dramatic.

One of my favorite tools for predicting the temperature on these warm days is the ProbCast tool developed by the Applied Physics Laboratory at University of Washington. As we obtain more and more computer power, ensemble forecasting (where we run a whole bunch of models with slightly perturbed initial conditions) is going to take over our more traditional, "deterministic" forecasting, where we run one model and base our forecasts off of that. The ProbCast tool gives the estimated high temperature based on multiple models, and also lists the 10% probability of the observed temperature exceeding or not reaching a certain temperature. My most memorable ProbCast experience was during our record heat wave of 2009, when Seattle hit 103 degrees, which was exactly what the Probcast was predicting.

Many news outlets are predicting the high temperature to be around 80 degrees or so. Let's see what the ProbCast says!

Credit: University of Washington Applied Physics/Atmospheric Sciences

85! Yikes! And there is a 10% chance that the temperature could exceed 89, meaning there is an outside chance the temperature could exceed 90! I personally think this is a little bullish and I don't think we'll hit 85, but low 80s is a good bet.

Credit: University of Washington Applied Physics/Atmospheric Sciences

Here's the ProbCast map throughout all of the Pacific Northwest for today. As you can see, many places west of the Cascades are forecast to be in the 80s - not just in Washington but in Oregon as well. If you want to escape the heat, go to Wyoming.

A big ridge of high pressure over our area is enough to make us warm and sunny, but the key to our record warmth is the offshore winds that are forecast to come down the Cascades into our area. As air sinks, it warms, and even though the air in the upper atmosphere is generally cooler than the air in the lower atmosphere, it warms at such a rate that by the time it reaches the lower atmosphere, it is often warmer than the air that was previously in place. The key to having offshore flow is to have higher pressure in Eastern Washington and lower pressure in Western Washington, and as the map below shows, we will have that today. It isn't the biggest pressure difference, so winds won't be too strong, but it is enough to bring us that warm, offshore flow while preventing the cooler, maritime, onshore flow from cooling off our neck of the woods.

Valid 05:00 pm PDT, Thu 07 Apr 2016 - 12 Fcst
Credit: University of Washington Atmospheric Sciences

On Friday, we'll start to cool down in Western Washington, but we'll still be pretty darn nice.  Eastern Washington will see it's warmest weather of the year. By Saturday, stronger onshore flow returns, cooling us off dramatically back into the 60s.

 Enjoy the sun!!!!!!!!!!!!!!!!!!!!!!!!!!!!!!!!!!!!!!!!!!!!!!!!!!!!!!!!!!!!!!!!!!!!!!!!!!!!!!!!!!!!!!!!!!
Charlie

Tuesday, April 5, 2016

Another Beautiful Week On Tap


Wow, what a change in weather we have had! From the wettest winter on record to two consecutive weeks with temperatures above 70 degrees! Our transition from autumn to winter is swift, but our transition from winter to spring usually takes a little bit more time. It certainly hasn't taken much time so far!

Last week, many places around Western Washington, including Sea-Tac, got into the 70s on Thursday and Friday. Although some morning clouds prevented us from reaching those same temperatures in the lowlands on Saturdays - temperatures were extremely warm in the mountains. I was skiing up at Alpental and was absolutely boiling. It was stunningly beautiful though, and I had a lot of fun.

The reason last week was so nice was because we had a large, persistent "Omega Block" right over our area, giving us clear skies, warm temperatures, and for some people (including myself), terrible allergies. We will also be warm and sunny later this week, but the warmth won't last for an extended period of time. However, Thursday in particular will be much warmer than any day last week.

Let's take a look at the WRF-GFS 1000-500 hPa thickness chart. I love this chart because it does a great job of quickly showing which areas are expected to be warm and which areas are expected to be cool. This is because "thickness" between two pressure levels is a function of density, and the less dense the air, the higher the thickness.

Here's what the thicknesses are like over the West Coast around 11 am this morning. As you can see, we have a ridge to our south with relatively high thicknesses over the area, but in order to get into the 70s, you'd want that ridge to become stronger and you'd want thicknesses to be in the 560s or higher.

Valid 11:00 am PDT, Tue 05 Apr 2016 - 6hr Fcst
 Credit: University of Washington Atmospheric Sciences

Wednesday morning, we look a little better. Right now, I think that Sea-Tac will stay below 70 on Wednesday, but I would not be surprised if they got all the way into the low 70s.

Valid 08:00 am PDT, Wed 06 Apr 2016 - 27hr Fcst
Credit: University of Washington Atmospheric Sciences

But wow, look at Thursday afternoon! Thursday is expected to be our warmest day of the week, with temperatures in the upper 70s for many locations. Sea-Tac's record high for that date was 78, set back in 1996. I think we are going to break it!!!

Valid 05:00 pm PDT, Thu 07 Apr 2016 - 72 Fcst
Credit: University of Washington Atmospheric Sciences

Another thing to look at is what the actual temperatures are like in the upper levels of the atmosphere. The Storm Prediction Center has a really cool tool where you can see the average and record values for a given parameter throughout the entire year. These parameters were measured using radiosondes - those big weather balloons with instruments that travel up to 100,000 feet through the atmosphere, taking measurements along the way.

850 hPa temperature climatology at Quillayute (UIL)
Credit: Storm Prediction Center

The 850 mb temperatures at 5 pm Thursday are forecast to be 16-17 degrees Celsius, which would set a new record not only for April 4th but for all of February and March as well, and possibly even January and April. Needless to say, it will be extremely warm in the upper atmosphere, and that warmth will make its way down to the surface.

Valid 05:00 pm PDT, Thu 07 Apr 2016 - 60 Fcst
Credit: University of Washington Atmospheric Sciences

A key factor for making temperatures really toasty here in the lowlands is the existence of offshore winds. We should have offshore flow on Thursday, with the foothills getting the strongest offshore flow and thus warming up the most. This will hold true for the coast as well - places like Forks (and, to a lesser extent, Quillayute) get a warming, offshore flow from the Olympics. I suspect that most places on the coast will set new record highs on Thursday.

On Friday, the ridge moves east of the area, but we should still have enough residual warmth to squeak out another day in the 70s. We cool off for the weekend, and beyond that, we look seasonable, with highs in the upper 50s to lower 60s with periods of light rain at times. Definitely a far cry from the intense windstorm we saw less than a month ago!

Charlie

Monday, April 4, 2016

The Demise of The West Antarctic Ice Sheet

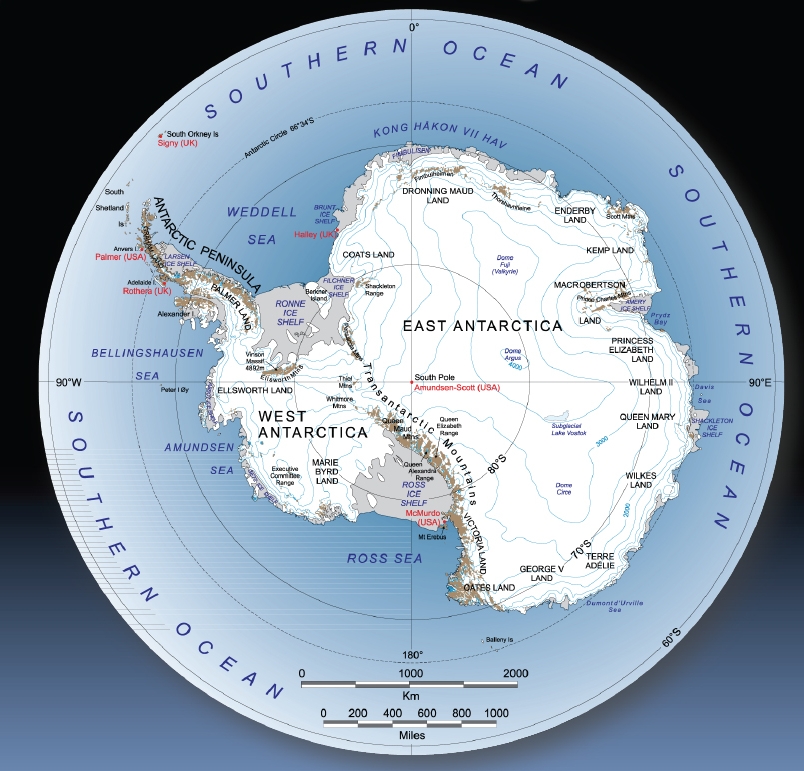
On Wednesday, the New York times came out with an alarming article. It said that a new, high-resolution model was showing that the West Antarctic Ice Sheet (WAIS), a massive ice sheet west of the "Transantarctic Mountains" that divides the continent into eastern and western sections, could melt far faster than previously thought, with sea levels rising as much as 6 feet by the end of the century. This is twice as high as what other models, such as those used in the reports given by the Intergovernmental Panel on Climate Change, were showing for a similar emissions scenario.

I am always skeptical of these types of articles. New York Times likely wouldn't publish a story like this if sea-level rise with this new model was a meter or less. That's simply not an exciting story to write. And the problem with publishing these types of articles is that it gives the impression to the public that a significant portion of the scientific community believes that the sea level could rise higher than Russell Wilson by the end of the century when, in reality, this is just one study in a field where a lot of uncertainty currently exists.

Credit: NASA

I minored in oceanography at the University of Washington and was pondering double majoring in it and atmospheric sciences, but I ultimately decided to simply go for the atmospheric sciences major because doing both of these wonderful majors would require me to stay at the UW for two additional years. Still, I took plenty of oceanography classes, and in multiple classes, my professors stressed the importance of the WAIS in deciding how much our sea-level could rise by the end of the century. 

Like many glaciers and ice caps around the world, the WAIS has been shrinking since the end of the "Little Ice Age," and global warming has accelerated this process. However, there is a lot of uncertainty as to how the WAIS will react to warming in the future. This is because large parts of Antarctica, including much of the WAIS, actually lie below sea level due to the massive weight of the ice above the continent weighing it down in a process known as isostatic depression.

Subglacial topography and bathymetry of Antarctica.
Credit: Paul V. Heinrich

As the picture above shows, land generally slopes downward as you go inland in West Antarctica due to isostatic depression. In fact, some inland areas are actually over a mile below sea level. Because of this unique feature, the ice sheet is unstable, meaning that even a little bit of a retreat of the WAIS could start a destabilization process that would lead to a collapse of the WAIS. Our current computer models do not have the capabilities to simulate this process, and significant uncertainty in the scientific community exists as to how quickly the WAIS will continue to melt, and if there ever will be a catastrophic collapse of a large section of the ice sheet.

As such, sea-level rise estimates span a pretty darn wide range, even for given "emissions forecasts" looking into the future. As shown below, there is a degree of overlap between the sea level rise with RCP 8.5 (the high-emissions scenario) and RCP 2.6 (the low-emissions scenario), suggesting that there is considerable uncertainty in how much the sea level will rise over the next century. And much of this uncertainty has to do with our poor handle on how the WAIS will behave in the future.

Credit: IPCC 5th Assessment Report

The New York Times article was based on this study on the "Contribution of Antarctica to past and future sea-level rise recently published in Nature. In the study, scientists showcased the results of a new, high resolution model that attempted to correctly model the response of the WAIS to subtle shifts in temperature. With this model, scientists were able to correctly reproduce the sea levels around 125,000 years ago, which are estimated to have been between 20 and 30 feet higher than today. Once they modeled this correctly, they used this model to forecast how the sea level would change in the future. According to the study, Antarctica alone has the potential to contribute one meter of sea-level rise by 2100 and over 15 meters (50 feet!) by 2500 if we continue to pump greenhouse gases into the atmosphere at the current rate.

Credit: Deconto and Pollard, 2016

Even more startling is the predicted rate of sea-level-rise. Since 1950, the sea level has been rising at about an inch per decade. Under the high-emissions (RCP 8.5) scenario, this new Antarctic model predicts that sea levels could rise as much as a foot per decade by the middle of the 22nd century. This would have tremendous impacts around the world, and while many large cities such as Miami, New Orleans, and New York City would be able to adapt to the increasing sea levels, it would be cost-prohibitive to build a seawall around the entire United States to protect all coastal areas from flooding. Donald Trump likes walls, but I believe our biggest threat in the future is from the ocean, not from our neighbors to the south. Developing countries would have an even harder time adapting.

Even though this all sounds very scary, it is important to remember that this is just one study. It is a very important study because it offers new insight into the fate of the WAIS, but in the coming years, more accurate, higher resolution models will be created, and we'll see if they come to similar conclusions. One thing is for sure - we need to decrease our CO2 emissions immediately, because we are just digging ourselves into a deeper and deeper hole. Honestly, when you consider the impact on future generations, I think it is quite selfish of us to be as lackadaisical as we have been. Global warming can't be avoided, but it can be mitigated. 

My challenge to you is to think about one thing you could do every day that would reduce your carbon footprint. Maybe it's taking the bus instead of driving to that doctor's appointment, or maybe it's wearing a sweater in the winter and turning down the thermostat a bit. Maybe it's simply going for a walk instead of watching TV, or maybe it is educating other people about climate change, ocean acidification, and sea level rise. Although our individual impacts on Earth's climate are negligible, we are having a profound impact on the Earth as a whole, so if we could all just work together to try and decrease that impact, that would be awesome.

Thanks for reading!!!
Charlie

Wednesday, March 30, 2016

Beautiful Week Ahead!

I had meant to get to this earlier, but then a funnel cloud occurred over Mill Creek and I had to write about that. Believe it or not, there are people who prefer stormy days with funnel clouds to beautiful, clear, warm sunny days, and I belong to that unique group. However, I'm a big fan of sun as well. In the words of John Ruskin, "there is no such thing as bad weather, only different kinds of good weather," so let's talk about the good weather ahead.

Well, on second thought, let's just talk about the good weather now. It is calm as can be on Lake Washington as I look outside my window, and the only clouds I see are some harmless cirrus clouds. Mt. St. Helens is always spectacular, but right now it is downright gorgeous. I'd love to hit the slopes of the Cascade volcanoes sometime.

Credit: US Forest Service

Right now, we have a HUGE ridge of high pressure over us. Those of you who read my blog regularly know how much I love the satellite images from the MODIS instruments aboard the AQUA and TERRA polar-orbiting satellites, so I'll post one here showing how clear it is over the West Coast. Even if you have no idea what the last sentence just meant, I'm sure you'll understand the picture.

High pressure over our area as seen from NASA's TERRA Satellite. Credit: NASA

Yeah, it's clear. By the way, that diagonal line you see simply shows the boundary of one passage around the pole of this satellite. The satellites that we usually use for meteorology are called "geostationary" satellites and are very useful because they orbit the Earth at the same velocity that the Earth is rotating, so they always stay above a single point on the equator. This allows them to get continuous shots of nearly every place on the globe. However, in order to be geostationary, they must be about 22,326 miles above sea level. Polar orbiting satellites do not have the advantage of remaining stationary over a single point, but they are only several hundred miles above the planet and can thus get much higher-resolution images.

The weather models show this too - the current UW flagship WRF-GFS model shows a massive ridge of high pressure over the Eastern Pacific.

Valid 05:00 pm PDT, Wed 30 Mar 2016 - 12hr Fcst
Credit: University of Washington Atmospheric Sciences
 
Also, notice how there are areas of low pressure on either side of the high - this pattern is known as an "omega block" because the flow resembles the Greek Letter omega - and it is a very hard pattern to break.

Idealized Omega Block
Credit: University Corporation for Atmospheric Research

This omega block will live up to its reputation, and won't go anywhere for the remainder of the week. 24 hours from now, the omega block has hardly moved at all.

Valid 05:00 pm PDT, Thu 31 Mar 2016 - 36hr Fcst
Credit: University of Washington Atmospheric Sciences

I don't think we'll be breaking any records, but highs on Thursday and Friday have a good chance of breaking the 70-degree mark for many areas in Western Washington, especially Friday. We "cool down" to the low 60s for the weekend, still well above our average high of 56, and turn rainy by next week. Still, we do not look stormy by any means. Spring arrived a little late this year, but I think it's safe to say that it is finally here.

Get outside, and don't forget to wear sunscreen!


Cheers,
Charlie

Tuesday, March 29, 2016

Funnel Cloud Over Mill Creek!


Credit: NASA AQUA Satellite, ~2pm on Easter Sunday, March 27, 2016

Yesterday was definitely a crazy day for weather! For much of the day, a pretty strong Puget Sound Convergence Zone set up shop in the Northern and Central Puget Sound regions, waxing and waning in intensity and shifting northward and southward as the day went on. The convergence zone ventured further south than usual, actually making it south of Seattle at times. The above satellite picture not only shows a well-defined convergence zone but also shows clearing to the north and south of the zone due to sinking air on either side of it, and lots of scattered clouds (popcorn) offshore denoting little showers and indicating an unstable atmosphere. An unstable atmosphere means there is a large decrease in temperature with height, and as Mother Nature would have it, Sea-Tac had a high of 55 yesterday while Snoqualmie Pass has picked up 8 inches of snow in the last 24 hours. There's still a ton of snow up there, go and get it before it all melts away by the end of this week (but that's for another blog).

Credit: Travis Miller

In addition to bringing gobs of snow to Stevens and Snoqualmie Passes, yesterday's convergence zone actually brought a funnel cloud to Mill Creek! Interestingly enough, funnel clouds are not all that uncommon with strong convergence zones. However, these are called "cold core" funnel clouds and are due to localized areas of circulation due to wind shear within the convergence zone. They are NOT like the funnel clouds and tornadoes common in the Great Plains, which are formed from supercell thunderstorms and are much larger and stronger. For comparison, take a look at the F5 tornado below from Manitoba. Yup, even Canadians get tornadoes!

Category F5 tornado approaching Elie, Manitoba on June 22, 2007
Retrieved from Wikipedia

Huge difference. Even so, even our little cold-core funnel clouds can become tornadoes, and when they do, they can cause quite a bit of destruction.

Supercells are large, severe thunderstorms with a rotating updraft, or mesocyclone. The mesocyclone forms when wind shear caused by relatively light winds at the surface and strong winds aloft creates a spinning vortex of air, and then strong updrafts tilt this updraft so that it is vertical. Both these pictures were taken from a powerpoint presentation I saved from my atmospheric sciences 452 (advanced synoptic meteorology and forecasting lab) class at the UW, and the credit goes to Nick Bond.


The difference in wind strength in the vertical can be quite high, especially in areas near the surface that are sheltered from the wind. I remember one time in December 2007 (the "Great Coastal Gale," to be exact), when winds around a mile up were an astounding 100 knots, while winds away from the immediate coast weren't even at advisory levels. The coast was a different story, and this was arguably the strongest storm on record for some parts of northwest Oregon and southwest Washington - even surpassing the Columbus Day storm!

While supercells get their rotation from differences in wind strength in the vertical, our tiny cold-core funnel clouds and tornadoes are formed from differences in wind strength in the horizontal. With convergence zones, you have winds coming from the south and winds coming from the north, and this can spin up small, localized vortices that manifest themselves as cold-core funnel clouds. I couldn't find a picture of this online, so I drew one myself. This is a picture of the convergence zone around the time that the funnel cloud was sighted, and the pinwheel represents a vortex formed by wind shear from the converging air streams. In this case, the pinwheel is over Mill Creek, which is where people spotted the funnel cloud.


In case you want to learn more about supercell thunderstorms, I have a much more detailed post here. I must of had a lot of time on my hands when I wrote it!!!

Thanks for reading!!!
Charlie