Wednesday, March 9, 2016

The Southeast Sucker!

Wednesday, March 9, 2016
12:09 pm

Meteorologists used to have very interesting names for different types of weather. I was introduced to the famed "Pineapple Express" back in elementary school, when it rained 5.02 inches at Sea-Tac during one incredibly rainy 5th grade day. Unfortunately, Pineapple Express seems to have fallen out of favor among meteorologists due to the rise of a potent cannabis strain of the same name, and has been replaced by the much more lifeless "atmospheric river." Indeed, it seems like creativity is being thrown out in favor of bland scientific jargon. How many times have you seen a meteorologist add the word "event" to any type of weather we experience? A "cyclone" has become a "wind event," a flood has become a "rain event," and in my opinion, it's only a matter of time before a "heat wave" becomes a "temperature event."

Thankfully, there are still plenty of meteorologists out there who have given creative yet intuitive names to the different types of weather we experience. We have "Tornado Alley," "snowpocalypse," and the "ozone hole." In our neck of the woods, we have the "rain shadow," the "convergence zone," and, of course, the "Blob." We have cyclogenic bombs and omega blocks, cloud streets and mackerel sky, El Nino and La Nina... the list goes on and on.

But my favorite of all of them? The "Southeast Sucker."

The Great Coastal Gale, the "mother of all Southeast Suckers" - Wolf Read
Image taken 09:00 pm PST, Sun 02 Dec 2007
Credit: University of Washington Online Weather Data Archive
Our current Southeast Sucker
Image taken 02:30 pm PST, Wed 09 Mar 2016
Credit: University of Washington Atmospheric Sciences

A Southeast Sucker is simply a strong windstorm that, due to a fairly far track offshore, creates a pressure gradient over our area that is more east-west oriented than north-south oriented. When this happens, the peak winds in many regions have a strong easterly component. With these storms, the strongest winds are generally found over the coast, the northern interior, and places that are exposed to easterly "gap" winds coming off the Cascades. Enumclaw and North Bend are two places that commonly get strong winds during southeast sucker events, but areas closer to the I-5 corridor can still get breezy if they have ample southeastern exposure.

However, with the exception of the foothills and Northern Interior, most of the Pacific Northwest lowlands west of the Cascades only get moderately breezy from these types of storms. This is because mountain ranges (the Olympics in Washington and the Coast Range in Oregon) help shelter these areas from strong winds and pressure gradients associated with the Sucker.

Here's what the National Weather Service had to say about the Sucker this morning.

"INLAND AREAS OF WRN WA WILL ALSO GET SOME WINDY WEATHER...THIS DEEP LOW IS A CLASSIC SOUTHEASTERLY SUCKER FOR THE INLAND PTN OF WRN WA AND THE WINDY SPOTS WILL BE FROM ADMIRALTY INLET UP THROUGH WHIDBEY AND THE SAN JUANS AND FROM ANACORTES TO BELLINGHAM BAY. FULL GALES CAN BE EXPECTED IN THESE AREAS AND A WIND ADVISORY IS IN EFFECT FOR THE LAND...LOCAL POWER OUTAGES ARE POSSIBLE."

They also produced a handy graphic to outline the impacts of the storm, shown below.

Credit: National Weather Service - Seattle

As you can see, the coast is expected to be the windiest, as it is closest to the storm and receives strong winds coming off the ocean, and it is currently under a high wind warning. The North Interior actually just got bumped up from a wind advisory to a high wind warning, and winds of 30-40 mph with gusts to 60 are expected there. Meanwhile, there are no wind warnings, advisories, or watches anywhere else in Western Washington, as the Olympics shelter many of us from these strong southeast winds. With our storms, the coast and north interior are almost always more windy than the Puget Sound lowlands, but this effect is amplified during these Southeast Sucker events.

Let's take a look at the track and winds of the current storm.

Valid 04:00 pm PST, Wed 09 Mar 2016 - 12hr Fcst

At 4 pm, the storm is between 130 and 135 degrees west longitude and around 45 degrees latitude. There are two centers of low pressure within the general cyclone itself, and this is not conducive to rapid storm development. Nevertheless, the cyclone is pretty deep at ~977 mb and will continue deepening. The coast, particularly the Oregon Coast, is experiencing high winds at this time.

Valid 10:00 pm PST, Wed 09 Mar 2016 - 18hr Fcst

By tonight, the storm has deepened further and is generally heading to the northeast. The two individual low pressure centers are doing a drunken waltz around each other and hindering the storm's development in the process. The front is approaching the coastline, and is bringing very strong winds with it. I would not be surprised if Cape Blanco, an exposed headland on the Southern Oregon Coast, receives gusts well over 100 mph from this storm.

Valid 04:00 am PST, Thu 10 Mar 2016 - 24hr Fcst

The storm continues to deepen early Thursday morning, and a powerful round of high winds approaches the Washington coast. It is now traveling to the NNE.

Valid 10:00 am PST, Thu 10 Mar 2016 - 30hr Fcst

The storm continues its northeastward trajectory before weakening and slipping to the south. Through it all, the coast has gotten absolutely pounded, the North Interior has taken a good beating, and most inland areas have escaped relatively unscathed. However, they will be wet, with some of the volcanic peaks such as Mt. Rainier and Mt. St. Helens possibly picking up as much as 10 inches of rain in 24 hours!

Valid 04:00 am PST, Thu 10 Mar 2016 - 24 Fcst

One more picture, and then I'll peace for now. This graphic shows the surface winds just like the graphics above, but does so at much higher resolution. If you look carefully, you can really see the easterly component to the winds north of the dramatic warm front near Grays Harbor.

Additionally, you can see that there are strong winds at the exit regions of gaps, with breezy conditions near Enumclaw, Randle, Gold Bar, and many other locations in the Cascade foothills. The northwestern tip of the Olympic Peninsula is particularly windy, with sustained winds of 45 knots near Tatooosh Island. I'm looking forward to reviewing some of the wind velocities from Tatoosh Island after this storm has passed, as they could be quite impressive.


Valid 04:00 pm PST, Wed 09 Mar 2016 - 12hr Fcst

Even though it will be mild, snow levels won't be sky high. It's snowing at Snoqualmie Pass right now. Let's hope it stays that way!

Peace for now,
Charlie

Tuesday, March 8, 2016

Seattle's Rainiest Winter Ever

Monday, March 7, 2016
1:43 pm

The Snohomish River topping its banks on December 9, 2015.
Credit: Brie Hawkins

I'll be the first to admit that weather forecasters are often wrong. After all, weather forecasting is the only job where you can be wrong 90 percent of the time and keep your job. Still, this winter has flummoxed many seasonal weather forecasters on the West Coast, and although it may not cost them their jobs, it is certainly bringing to light our ineptitude with regards to seasonal forecasting. Forecast models were adamant that the Pacific Northwest would see drier-than-normal conditions throughout the winter, and that the Southwest would be wetter than normal, bringing desperately-needed rainfall to drought-stricken California. Instead, the Pacific Northwest had one of their wettest winters on record, and the southwest was actually drier than normal. Although farmers in our region aren't complaining, I'm sure that many in California are absolutely furious at meteorologists. I know I would be!

Credit: Western Regional Climate Center

In fact, since our October 1st, which is the beginning of our "water year," some places in the Pacific Northwest have received more than 20 inches above average of their precipitation for this period. In fact, many areas on the Olympic Peninsula have picked up over 100 inches of rain since then!

Meanwhile, Los Angeles and other areas in Southern California are running several inches below average. Talk about no rest for the weary!

Credit: National Weather Service Advanced Hydrologic Prediction Service
Credit: Western Regional Climate Center

So, what happened?

El Ninos generally give wetter-than-normal conditions to California after the New Year (there is little correlation before January 1st), and this is due to a large area of low pressure setting up in the Eastern Pacific, allowing the jet stream to sag southward into California. We had a wet October and November and a downright stormy December, and while an El Nino pattern did develop after the New Year, there was also a persistent ridge of high pressure over Southern California, pushing the jet stream back north into our region for extended periods of time and giving us relatively warm and wet southwesterly flow in the process. In the graphic below, the negative anomalies correspond to areas of lower pressure and vise versa.

Credit: NOAA Earth Systems Research Laboratory

"Astronomical winter" is defined as the period from the winter solstice to the vernal (spring) equinox, which is approximately from December 21st to March 20th, with the dates occasionally changing due to one calendar year not being exactly equal to the period of the Earth's orbit around the sun. However, most people would agree that Hanukkah feels more winter-ish than St. Patrick's Day, so we've come up with the term "meteorological winter" to define winter based on what the weather is like outside.

Meteorological winter is officially defined as December 1st to February 28 for the entire country. We had the wettest meteorological winter on record by far here in Seattle, with 24.54 inches of rain from December to the 28th of February (and 24.63 inches if you count February 29th), besting the record of 22.77 inches set in 1998-1999.

Cliff Mass, one of my atmospheric sciences professors at the University of Washington, defines our "meteorological winter" as the period from October 1st to March 1st, and while this is a fair bit broader than the previous definition, it makes sense, considering that these are the primary months that our storms come through. For this reason, October 1st is said to mark the beginning of the "water year," and boy oh boy did we have a lot of water this year. From October 1st to March 1st, we had 38.62 inches of rain in Sea-Tac, breaking the previous record of 38.19 (also set in 1998-1999). That's more rain than Sea-Tac usually receives in an entire year! Seattle has nearly 40 inches as of Tuesday afternoon, and heavy rains and flooding are predicted Wednesday night, with unsettled weather the rest of the week.

My personal definition of meteorological winter is from Veteran's Day to Valentine's Day, because it's nearly impossible to get significant lowland snowstorms here outside of those dates. Compiling statistics for my own "meteorological winter" definition would be extremely time-consuming and not very productive, but I'm willing to bet that 2015-2016 was also the wettest year for the Veteran's Day to Valentine's Day time frame.

An interesting thing to note was that although this winter was very wet, we didn't have a ton of record-breaking rainfall events. Instead, we simply remained in a rainy pattern for the entire winter and had relatively few dry spells.

Credit: University of Washington Atmospheric Sciences

Even though we've been wet, we've also been warmer than normal (though not nearly as warm as we were last year). As such, our snowpack is right around normal. But you can bet your bonnet that our streams and reservoirs are running high and that our soils are saturated. Salmon will have a much easier time getting up the rivers to spawn this autumn, and hopefully we will have less fire danger this summer due to increased soil and crop moisture.

In the meantime, long range forecasts are predicting us to be cooler and wetter for next winter as we head into a La Nina pattern! However, after this winter, I'm not sure whether I should ever believe the Climate Prediction Center's outlooks again.

Cliff Mass at the 2016 Pacific Northwest Weather Workshop talking about how bad our seasonal precipitation forecasts were this year. Credit: Logan Johnson

Thanks for reading!
Charlie

Monday, February 29, 2016

The Transition of Seasons

Thursday, February 25, 2016
12:17 pm

I apologize for the delay in blog posts and Facebook updates. Yes, I've been busy, but moreover, there hasn't been much weather going on. I've had trouble thinking of things to write about, so I've started posts and just never finished them. Perhaps one day I will.

Then, it occurred to me. Perhaps I should write a blog about our lack of weather. There is something to be said for nothing happening, especially after having one of the wettest winters on record for the area (and by some measures, the wettest winter of all time). After all, in the words of the Whether Man, "it is more important to know whether there will be weather, whether than what the weather will be."

The Whether Man from Norton Juster's "The Phantom Tollbooth"
Illustrated by Jules Feiffer
Retrieved from annaforrester.wordpress.com

It seems like every year, around November 1st, the heavens open up and our stormy season begins. We cool off dramatically, and by mid-late November, we’ve historically seen our first significant lowland snowstorms. We are at our stormiest by Thanksgiving, and we slowly calm down from there, nevertheless remaining pretty stormy right through January. However, by the time mid-February rolls around, we’ve calmed down significantly, and after Valentine’s Day, it’s much harder to get snow in the lowlands. All of this begs the question: why do we have a storm season, and why does it approximately start and end on these dates?

To understand why we get our storms, you have to understand the mechanisms that form them. Our storms are midlatitude cyclones, and get their energy from north-south temperature differences in the Westerlies. Generally, the larger the temperature difference, the stronger the cyclone. As the graphic below shows, mid-latitude cyclones need, among other things, a meridional temperature difference and some wind shear to get started. Once there is a bit of rotation, a cold and warm front begin to appear, with the cold front eventually catching up to the warm front and forming an occluded front before the storm finally dissipates.

Credit: UC San Diego

The "jet stream", the band of high-altitude winds in the mid-latitudes, is determined by temperature differences throughout the atmosphere which then result in the pressure gradients that drive the jet stream. The stronger the temperature difference, the stronger the jet stream that feeds energy into the storm. The jet stream is typically at its strongest in the Western Pacific where there is a stark difference in temperatures from Siberia to the north and the warm water of the equatorial Western Pacific to the south. Some of the most intense extratropical storms in the world form in the Northwest Pacific. Thankfully, we don't have to deal with these, but Alaska does on occasion!

How temperature affects pressure gradients, which in turn affect the strength of the jet stream. The jet stream is the geostrophic wind (parallel to isobars, or lines of constant pressure) around 200-300 mb.
Credit: University of Illinois

During the autumn, the northern hemisphere starts to tilt away from the sun, causing the polar regions to cool off dramatically while the subtropical regions are still relatively warm. This is why November is such a stormy month for us; there is a large temperature difference from north-to-south and thus a strong jet stream that is more often than not pointed directly at the Pacific Northwest. Moreover, some of our biggest storms, such as the Columbus Day Storm of 1962, occur when tropical systems from the Western Pacific actually get sucked up into the westerlies and transition to extratropical storms. As the graph below shows, there are still a fair number of cyclones that occur during the months of November and December in the Western Pacific, but very few occur from January to April.

Credit: UCAR MetEd COMET Program

As we go into December and January, the polar regions continue to cool, but the subtropics cool off as well. By late February, the polar regions are starting to warm dramatically while warming is much more modest in the subtropics, leading to a smaller north-south temperature difference and thus a weaker jet stream, with weaker and less frequent storms affecting us here in the Pacific Northwest. This trend continues throughout the summer, with the smallest north-south change in temperature in the northern Hemisphere occurring around late July/early August. After that, the temperature discrepancies start to pick up, and we start to see progressively more and more powerful storms.

Jet stream in the summer and winter. As you can see, the jet stream is stronger and further south during the winter due to increased north-south temperature gradients, giving stronger storms and heavier precipitation to the West Coast.
Credit:UCAR MetEd COMET Program

Even though we are relatively calm in the spring, many other places in the midlatitudes are actually wetter in the spring than the winter. For example, Oklahoma City's dry season is from November to February, with precipitation sharply increasing in the spring and decreasing slightly for the summer months. This is because unlike us, Oklahoma City gets the majority of their precipitation from thunderstorms and squalls. These storms have a tough time forming in winter, but once spring comes around, look out!

Credit: NOAA National Severe Storms Laboratory

While the north/south temperature gradients are not as strong in the spring, this is when the difference in temperature between the surface and aloft is the highest. When there is a large decrease in temperature with height, the atmosphere is very unstable, and there is a ton of potential energy available for thunderstorm formation. Typically, warm, moist air from the Gulf of Mexico comes in at low levels, while hot, dry air from the desert southwest comes in at mid-levels, creating an inversion that initially prevents any clouds from forming. However, this inversion acts as a pressure-cooker of sorts, and as the lower atmosphere heats up during the day, the inversion becomes weaker and weaker until it can no longer contain the hot, moist air at the surface. When the inversion finally buckles and the air starts to rise, it rises incredibly fast and violently and to great heights due to the cold air surrounding it and the fact that it is less dense than the surrounding air. 

Our storm season may be coming to an end, but it won't be long before we'll be talking about severe springtime thunderstorms. Although not every place is blessed with fascinating weather all the time, you'd be hard-pressed to find a time when there's no interesting weather anywhere in the world.

Charlie

Wednesday, February 17, 2016

Snow To Return To The Cascades

Wednesday, February 17, 2016
6:15 pm

It was a bad week for the snow-lovers of the Pacific Northwest. Over the past couple days, we've had very moist and relatively mild flow coming into our region from the WSW. The result? Heavy rains on the Olympics and Northern Cascades, with much lighter precipitation in the Seattle area due to rainshadowing by the Olympics. These "atmospheric rivers" are really good for showing how much our topography affects our weather around the region. Take a look at some radar-estimated precipitation totals from the storm and compare them a topographical map of the Pacific Northwest. Notice any similarities?

Credit: National Weather Service
Credit: University of Washington
There's clearly more precipitation on windward slopes and less on leeward slopes, with 3-4 inches in some places on the windward slopes of the central and northern Washington Cascades and nothing on the eastern slopes. Amazing! You can even see an increase in precipitation due to the Blue Mountains in Northeast Oregon.

One more graphic... look how much topography affects annual rainfall around the state. It's just another thing that makes forecasting the weather around here so much fun!

Credit: Chris Daly and Mike Halblelb of the Oregon State University PRISM group
Retrieved from University of Washington

You can get 200+ inches of precipitation on the highest peaks of the Olympics, but Sequim, on the northeastern part of the Olympic Peninsula, only gets around 16 inches of rain a year - nearly the same amount as Los Angeles. Heck, Sequim is even home to the "Brittle Prickly Pear" cactus - the only cactus native to Western Washington. You won't find any of those in the Hoh Rainforest!

The good news for snow-lovers is that more snow is on the way. It's raining at the passes right now, but snow levels, currently at 6,000 feet, will continue to drop as the week goes on. By noon Thursday, the white stuff should finally be falling again at Snoqualmie Pass.

Valid 04:00 pm PST, Wed 17 Feb 2016
Credit: University of Washington Atmospheric Sciences

The graphic above shows the "thickness" of the atmosphere between the 1000 and 500 hPa pressure levels. Warm air is less dense, so the higher the thickness, the warmer the air throughout that column. Units are in "dam," which stands for decameters (tens of meters). You can see how although we have relatively low heights associated with a cooler air mass and lower snow levels offshore, the counterclockwise flow around the low is still pumping relatively warm, moist air into our region. As a result, we are seeing warm temperatures and heavy rain in many regions right now.

Credit: University of Washington Atmospheric Sciences

However, by tomorrow morning, thicknesses have dropped by nearly 150 meters. 

Valid 10:00 am PST, Thu 18 Feb 2016 - 18hr Fcst
Credit: University of Washington Atmospheric Sciences

Now the graphic everybody cares about: 24-hour snow accumulation.

Valid 04:00 pm PST, Thu 18 Feb 2016 - 24hr Fcst
Credit: University of Washington Atmospheric Sciences

We finally get some snow here, but areas further south get pummeled with the white stuff. The Sierra Nevada gets feet rather than inches. The Sierra Nevada are very tall mountains that rise dramatically from the Central Valley, so they are very efficient at wringing out moisture. If we had the Sierra Nevada and California had the relatively short Cascades, then skiers, farmers, and utility companies here would be in 7th heaven and California would be in a whole lot more trouble than they are now. 

Over the next 24 hours, the focus of the snow shifts north and snow levels plummet below 2,000 feet. 

Valid 04:00 am PST, Sat 20 Feb 2016 - 60hr Fcst
Credit: University of Washington Atmospheric Sciences

Skiing should be fantastic this weekend. Saturday in particular should be spectacular, with snowfall decreasing throughout the day. Another system comes in Sunday afternoon, but once again, this one should bring more snow than rain to the Cascades, at least at all the major passes. 

Hit the slopes this weekend!
Charlie

Sunday, February 14, 2016

Everything You Need To Know About Gravitational Waves

Thursday, February 11, 2016
8:12 pm

According to my mom, I memorized the names of "all the moons of Jupiter" thanks to this book.
Retrieved from www.goodreads.com

Although it has been my most enduring, meteorology was not my first foray into the natural sciences. When I was in preschool, I was obsessed with volcanoes and astronomy, two things I still love today. I clearly remember taking a trip to the "Big Island" of Hawaii when I was in kindergarten with my family and throwing a fit when we went to Kilauea and the "hot lava" that was so vividly portrayed in the video cassettes I religiously watched at home was nowhere to be found. Although I don't remember any of them now, my mom says that I memorized all the moons of Jupiter given in the book above. Seeing as Jupiter has 67 moons, I think she might be exaggerating a bit, but I may have memorized the four Galilean moons (she recalls me memorizing 8 or so).

I may have been a highly touted intellectual science prospect throughout preschool, but those expectations fell flat when I encountered a more strenuous workload in middle school, and you need look no further than my performance in the calculus-based introductory physics series at the University of Washington to see that I'm a hobbyist at heart, not a scientist. Thankfully, scientists came along and developed the internet, so hobbyists like myself can still entertain ourselves by blogging about things we aspire to comprehend.

So, as you can imagine, when I heard the news on Thursday that a team of absurdly smart scientists were claiming to have discovered direct evidence of gravitational waves, waves in the space-time fabric of the universe, from two black holes smashing into each other over a billion light years away, I had to enter the blogosphere and give the internet my two cents on it.

But before I did that, I had to brush up on my knowledge of Einstein's theories of special and general relativity.

Smart guy!
Credit:  Ferdinand Schmutzer (retrieved from Wikipedia)

We are used to thinking of space and time as independent of each other. We imagine that there are three spatial dimensions that describe our world, and there is time, which just 'keeps on going' at the same rate for everybody. Time anchors us. In a crazy world with terrorism, climate change, nuclear proliferation, disease, and reality TV stars storming their way to the Republican nomination, we can all rest easy knowing one thing. At least we all abide by one common clock, right?

Wrong.

In 1905, Einstein was a 26-year-old university graduate who was working in a patent office. He enjoyed producing groundbreaking physics work in his spare time, and in 1905, he produced his theory of special relativity. This theory has two parts. First, it says that the laws of physics are identical throughout the universe for any "inertial" (non-accelerating) observer. Second, it says that the speed of light is the same for all observers. These may seem like commonsense, innocuous statements, but they have profound implications. As you will see, while some things are absolute, such as the speed light, other things are relative based on the observer, such as space and time.

Own graphic, created with Microsoft PowerPoint

Imagine that you are in a vintage race car traveling 70 miles per hour to the east, and your buddy's jalopy is traveling at 30 mph to the west. In this case, your buddy's car is traveling towards you at 100 mph. This is because YOUR car is not traveling away from you at all - it is traveling at a lowly 0 mph relative to you. Likewise, from your buddy's perspective, his car is not moving at all, but your car is moving towards him at 100 mph. At first, this seems like a paradox: how can something be moving at 0 mph and 100 mph at the same time? Of course, it all makes sense when you take who's driving the car into account. This illustrates the concept of inertial reference frame, where any arbitrary, non-accelerating object can be defined as being stationary while other objects are whizzing all around in every direction. I may think I'm stationary sitting here writing this blog, and I am from my reference frame, but try asking the man on the moon if I'm stationary. Heck, he can only see me for half of the day!

Weird things happen when you travel at speeds close to the speed of light. Say, for example, that I am flying in a spaceship at the speed of light to the east, and my buddy is flying at the speed of light to the west. It would seem, then, that from my inertial reference frame, my buddy is traveling at two times the speed of light away from me. In the graphic below, 'c' stands for the speed of light, while '2c' stands for twice the speed of light.

Own graphic, created with Microsoft PowerPoint

However, this is not possible. Due to the theory of special relativity, since we are both non-accelerating objects, the same laws of physics apply for us, and the speed of light is the same for us. Nothing can travel faster than the speed of light. Therefore, my buddy is only traveling the speed of light away from me, not twice the speed of light. How can this be?

Own graphic, created with Microsoft PowerPoint

In the car example, the speed of my car was completely dependent on reference frame. I could've been going 0 mph or I could have been going 100 mph. If there was a hitchhiker standing on the side of the roadway, he would have said I was going 70 mph. And as it turns out, time, just like speed, position, and so many other things, is relative.

If I'm traveling at light speed away from my buddy and he doesn't appear to be going anywhere, then time is going normally for me, but no time has passed for him. If time was going for him, he would be moving!

And because the speed of light is equal to length divided by time, if time is relative, it turns out that length is too! If time passes more slowly for other objects flying by the observer than the observer himself in his inertial reference frame, then the length of those objects the observer sees must contract in order to satisfy the relationship between time, length, and the speed of light. For example, if I'm flying by a spaceship at 3/5ths the speed of light, for me, the spaceship is only 4/5ths as long as it is in its own reference frame, and for every second that has passed on the spaceship, 1.25 seconds have passed for me. These concepts are called length contraction and time dilation, respectively, and they are not intuitive at all. You can learn more about them here.

There are other consequences of special relativity, a major one being that events that may appear simultaneous to one observer may not appear simultaneous to another observer. Also, weird stuff happens when you are accelerating (i.e. not in an inertial reference frame). It's all incredibly confusing and counter-intuitive.

But what all of this stuff means is that space and time are not separate entities. They are intrinsically woven together, and we call this entity space-time.That's right: in our overly chaotic world, space and even time are relative to the observer. Thankfully, these effects only become noticeable when traveling at "relativistic" speeds... i.e., speeds approaching the speed of light. Otherwise, I imagine everyday communication would be quite difficult!

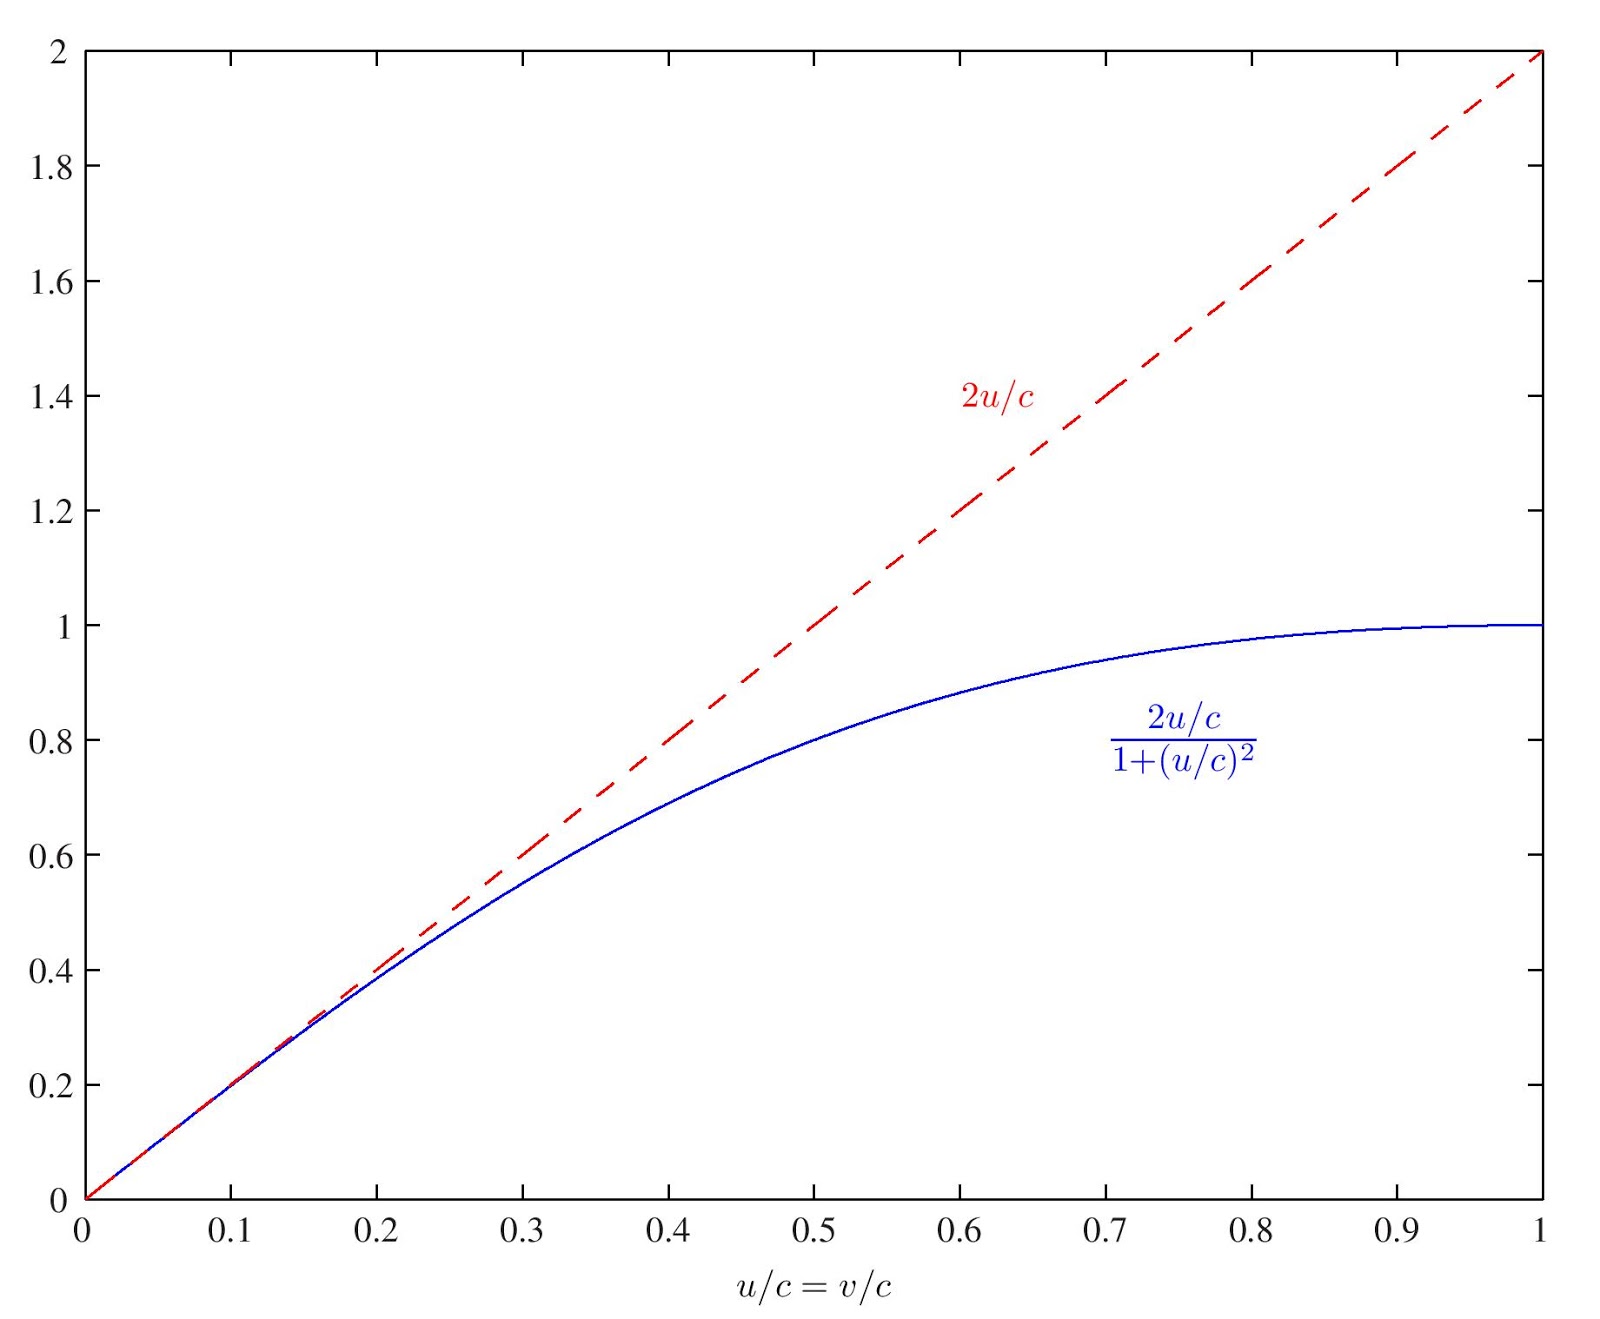
For example, let's imagine that the aforementioned rockets can go at all speeds. The dashed line here represents the relative speed of one rocket from another (in terms of its velocity divided by the speed of light) if we just take the sum of the parts like we did with the cars. The blue line shows the relative speed if we take special relativity into account, like we did with the rockets. There isn't much of a difference until after v/c=.1, meaning that the velocity (v) is 1/10th the speed of light. One tenth the speed of light is 66,960,000 miles per hour! So yes, relativity affects us all, but the effects are so small that it is impossible for us to notice them. Still it's fascinating to know that any movement has an effect on time and length from your reference frame.

Credit: physics.stackexchange.com/

Whew! If you made it through that, then you'll have no problem getting through the rest of this blog.

Obviously, 1905 was a good year for Einstein. In addition to his theory of special relativity, he published revolutionary papers on Brownian motion, the photoelectric effect, and mass-energy equivalence (E=mc2). However, his best work was yet to come.

Einstein liked his theory of special relativity, but he wasn't content with it. Special relativity was only concerned with inertial reference frames, and Einstein wanted to make a theory that was compatible with all reference frames. In other words, he sought to include acceleration into his theory. He began his quest for a new, more generalized theory in 1907, and after eight years of blood, sweat, and tears, he published his theory of general relativity, a theory which has served as one of the pillars of modern physics ever since.

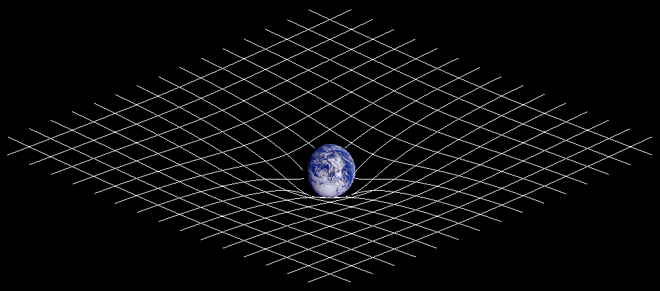
The mass of the Earth bending space-time around it, creating gravity
Retrieved from Wikipedia

In his law of universal gravitation, Isaac Newton stated that any two objects in the universe attract each other, and that attraction is due to the intrinsic mass of the objects. He didn't know why they attracted each other, but he just knew that they did, and that the more massive the object and the closer the object was to neighboring objects, the stronger the attraction was.

When coming up with his theory of general relativity, Einstein actually apologized to Newton in his notebook, writing "Newton, forgive me. You found the only way which, in your age, was just about possible for a man of highest thought and creative power." In his theory, Einstein finally had an explanation for why gravity existed. In Einstein's theory of general relativity, gravity is not simply an innate force between two objects. Instead, gravity is a consequence of the influence of mass on space-time. Mass, he proposed, curves space-time, and this curvature is felt as the "force" of gravity.

Take a look at the diagram of the Earth above. Due to its mass, it bends space-time, with the most bend occurring closest to the Earth. Now, imagine that you have a ball rolling on the space-time surface. It will roll towards the Earth, and will roll fastest when it is closest to the Earth, where the slope of space-time - and therefore, the force of gravity - is the steepest/strongest. Of course, this ball, which has mass, will also bend space-time. Technically, this bend extends throughout the entire universe, but the effect of the Earth's mass on the curvature of space-time is negligible once you get out of our solar system, so it's really negligible in galaxies billions of light-years away.

Credit: pics-about-space.com

The fact that mass bends space-time has some important implications, with two of the most important being the theorized existence of black holes and gravitational waves. Black holes are regions where the curvature in space-time, and by association, the gravitational force, is so drastic that nothing, not even light, can escape past a certain point, known as the event horizon. In fact, all the mass of the black hole is located at the "singularity," which has no volume, infinite density, and infinite space-time curvature. Black holes had been theorized and indirectly observed but never observed directly until September 2015. After a lengthy, arduous process of research and verification, these findings were announced to the world on Thursday, February 11, 2016.

However, the bigger story has been how we obtained direct evidence of the existence of black holes. And we did that by the first ever direct observation of gravitational waves.

Gravitational waves produced by two black holes orbiting each other
Credit: NASA (retrieved from www.space.com)

Gravitational waves are undulations in space-time that propagate as waves from a given source. Although mass curves space-time, the curve stays centered on that specific mass. With gravitational waves, these curves propagate throughout the universe, far away from the center of mass from which they are originating.

Credit: Malter
Retrieved from Wikimedia Commons

Gravitational waves are sinusoidal, meaning they oscillate smoothly according to the y-coordinate of a rhythmic trace of a circle. These waves, called "sine" waves, are everywhere. Light waves, sound waves, and even water waves are sinusoidal. For example, the "A" below is a sine wave.

Hear the sound of this wave here
Credit: University of Minnesota

Music is made of a whole bunch of sine waves, and although it doesn't look as neat, it sounds a lot better. Here is a "waveform analysis" I made of Van Halen's "Hot For Teacher."

Created with Sigview Spectrum Analyzer

Gravitational waves, by bending space and time, actually move stuff in very specific patterns. I found a handy collection of animated gifs online at Universe Today, but these were all originally retrieved from Einstein Online, a fantastic resource for laypeople who want to learn about relativity and all things Einstein. I heavily used Einstein Online when writing this blog!


Let's imagine that we have a bunch of red dots laid out in a circular fashion. A gravitational wave, when passing perpendicular to this circle of dots (into the screen), would cause them to stretch and contract in a rhythmic fashion. Check it out!


Insane, right? And remember, it's stretching and contracting time, too.

Now, let's extend this to the third dimension. Instead of having one circle, we'll stack a whole bunch of them together to make a cylinder. Also, we'll connect the dots with some imaginary blue lines just so it is easier to see how the wave propagates through the cylinder.


Here is the view of the wave coming perpendicular to the ends of the cylinder. Trippy!


And here's a side view. You can really see the sinusoidal nature of the wave.


There are many different types of gravitational waves. The one above is a "linearly polarized" gravity wave. There are other polarizations, such as circular and elliptical polarization, and the polarization has to do with the electromagnetic nature of the wave. Additionally, these waves occur at a vast variety of frequencies corresponding to the objects that produced the waves and how far the waves have traveled. 

Credit: LIGO Scientific Collaboration

So, gravitational waves move temporarily distort time and space for certain regions before they continue their journey onward throughout the rest of the universe. But how the heck do we measure these things?

I hope nobody was in that lookout!
Credit: Defense Research and Development Canada

As we saw, the gravitational waves moving through something distort its shape. However, there are lots of waves that can move through things and distort their shapes. Seismic waves distort the shape of the ground. Water waves distort the shape of the water. Shock waves, such as the one you see emanating from the explosion above, can set off car alarms, bring down buildings, and scare the living crap out of your dog. Therefore, how did these scientists deduce that the waves they observed were of the gravitational variety?

The LIGO Control Room in Hanford, Washington
Credit: Tobin Fricke

Enter LIGO, which stands for the "Laser Interferometer Gravitational-Wave Observatory." LIGO is primarily funded by the National Science Foundation and draws scientists from all around the world. It was originally founded in 1992 by a group of scientists from MIT and Caltech, and began operations in 2002. Between 2002 and 2010, it failed to discover any gravitational waves, and was subsequently shut down for enhancements, finally coming back online in February of 2015.

Ligo Hanford (left) and Ligo Livingston (right)
Credit: LIGO Scientific Collaboration

LIGO consists of two giant L-shaped observatories, one in Hanford, Washington, and one in Livingston, Louisiana, with each "arm" being 4 kilometers long. As the LIGO acronym suggests, these observatories are "Laser Interferometers," meaning they split a laser beam and see how the two laser beams interfere with each other. The beams are calibrated so that, under normal conditions, there will be perfect "destructive interference," which is where the light beams (which are sine waves) are perfectly opposite each other so that adding them together creates a straight line and thus a complete absence of light.

LIGO interferometer design. Credit: LIGO Scientific Collaboration

When a gravitational wave comes, space-time is distorted, and as such, the arms of the observatory lengthen and contract rhythmically, with one arm lengthening as the other contracts and vice versa. Due to this changing length, the laser beams no longer perfectly cancel each other out, and light shines through.

The change in arm length is on the small side - typical changes are on the order of 1/10,000th the width of a proton! Incredibly, the interferometers are sensitive enough to measure this change. I don't know how they do it. To determine whether the readings were due to gravitational waves and not - say - a 9.0 Cascadia Subduction Zone earthquake, scientists are on the lookout for specific patterns that suggest the passing of a gravitational wave. Here are their exact measurements from the gravitational wave everybody is talking about.

Credit: Abbott et al.  (2016)

Gravitational waves are made by extremely violent events in the universe, and these gravitational waves were theorized to have been created by the collision of two black holes, one 36 times the mass of the sun and the other 29 times as massive. They circled and approached each other at half the speed of light and eventually collided to make a single black hole 62 times as massive as the sun. Three solar masses were transformed into energy (remember E=mc2?), and 50 times as much power as the output of all stars in the universe was sent radiating into the space at the speed of light. 

1.3 billion years later, on September 14, 2015, scientists found the specific pattern they were looking for, and the fact that it occurred at both the Hanford and Livingston observatories at almost exactly the same time proved that it was not simply a local disturbance. The signal only lasted for 20 milliseconds and only moved the LIGO mirrors four thousandths of the diameter of a proton, but they had finally captured direct evidence of both black holes and gravitational waves. Although gravitational waves are not sound waves, the frequency of these waves is a frequency that our ear can detect, so by converting the gravitational waves to sound waves, we can hear the sounds of these two black holes colliding. Listen to them here

I'm not an astrophysicist, but what from what I've read, the discovery of these waves is one of the most important astronomical discoveries of all-time. According to Abhay Ashtekar, a physics theorist at Penn State, "it's really comparable only to Galileo taking up the telescope and looking at the planets. Our understanding of the heavens changed dramatically." I think a good comparison is to the discovery of radio waves 130 years ago by Heinrich Hertz. Since then, radio waves have completely changed our way of life. 

So far, the vast majority of our observations of the universe have come from electromagnetic radiation. Radio waves, infrared waves, visible light, x-rays, gamma rays... you get the idea. However, not everything in the universe emits electromagnetic radiation. Black holes don't... that's why they are called black holes! We would be able to see dark matter and dark energy. But that's not what I'm most excited about.

Credit: NASA

According to the big bang theory, the very early universe was opaque to electromagnetic radiation, and we cannot see further back than 380,000 years after the big bang. However, it was not opaque to gravitational waves, meaning that if we get a clear enough view, we should actually be able to see the big bang itself. We'll go all the way back to the very beginning of time: the "singularity," where all of the matter in the universe was contained in an infinitely small, infinitely dense, and unimaginably hot point. Or we'll discover that the Big Bang didn't happen at all. However, the existence of gravitational waves adds credence to the big bang theory.

"Imagination is more important than knowledge," Einstein once said. For knowledge is limited to all we now know and understand, while imagination embraces the entire world, and all there ever will be to know and understand." I can only imagine what we'll discover next!


Bibliography:

Abbott, B. P. et al. (2016). Observation of Gravitational Waves from a Binary Black Hole Merger. Physics Review Letters, 116(061102). Retrieved February 13, 2016, from http://journals.aps.org/prl/abstract/10.1103/PhysRevLett.116.061102

Adams, K. S. (n.d.). High Energy Groove: X-Ray Binary. Retrieved February 12, 2016, from http://heasarc.nasa.gov/docs/xte/outreach/HEG/bhm/black_hole_mass.html

Albert Einstein. (n.d.). Retrieved February 11, 2016, from https://en.wikipedia.org/wiki/Albert_Einstein

Choi, C. Q. (2014, October 24). Einstein's Gravity Waves Could Be Found with New Method. Retrieved February 12, 2016, from http://www.space.com/27510-gravitational-wave-detection-method.html

Elementary Einstein. (n.d.). Retrieved February 13, 2016, from http://www.einstein-online.info/elementary

Fowler, M. (n.d.). Special Relativity: What Time is it? Retrieved February 11, 2016, from http://galileoandeinstein.physics.virginia.edu/lectures/srelwhat.html

General Relativity. (2016, February 12). Retrieved February 12, 2016, from https://en.wikipedia.org/wiki/General_relativity

LIGO. (2016, February 13). Retrieved February 13, 2016, from https://en.wikipedia.org/wiki/LIGO

Nave, C. R. (n.d.). Time Dilation/Length Contraction. Retrieved February 11, 2016, from http://hyperphysics.phy-astr.gsu.edu/hbase/relativ/tdil.html

Norton, J. D. (2015, January 14). Special Relativity Basics - Relativity of Simutaneity. Retrieved February 11, 2016, from http://www.pitt.edu/~jdnorton/teaching/HPS_0410/chapters/Special_relativity_rel_sim/

Polarization (Waves). (2016, February 13). Retrieved February 13, 2016, from https://en.wikipedia.org/wiki/Polarization_(waves)

Radford, T. (2016, February 11). Gravitational waves: Breakthrough discovery after a century of expectation. Retrieved February 11, 2016, from https://www.theguardian.com/science/2016/feb/11/gravitational-waves-discovery-hailed-as-breakthrough-of-the-century

Rogness, J. (n.d.). Trigonometry in Nature - Sinusoidal Waves as Sound. Retrieved February 12, 2016, from http://www.math.umn.edu/~rogness/math1155/soundwaves/

Special Relativity. (2016, February 2). Retrieved February 11, 2016, from https://en.wikipedia.org/wiki/Special_relativity

Spotlights on relativity. (2016). Retrieved February 13, 2016, from http://www.einstein-online.info/spotlights

Timeline of the Universe. (2012, December 21). Retrieved February 13, 2016, from http://map.gsfc.nasa.gov/media/060915/index.html