Wednesday, November 4, 2015

Snow Arriving Right On Time For Snoqualmie Pass

Wednesday, November 4, 2015
6:02 pm

A view of foggy Snoqualmie Pass from Chair 2, Alpental. Credit: ME!

When I talk about snow in the Cascades, I often tend to focus on Snoqualmie Pass. This is probably because this is where I have skied most of my life (particularly Alpental), but Snoqualmie Pass is also the largest pass through the Cascades, with the exception of the Columbia River Gorge separating Oregon and Washington. Snoqualmie Pass is also the pass that will be most affected by global warming due to its low elevation. Snoqualmie Pass will never have another ski season after 2100; take it to the bank! They may get decent (by 22nd century standards) snowfall amounts on a particular year, but running a ski season will no longer be profitable. Temperatures will be too high.

However, we've still got 85 years to go until then, and we should get a few solid decades from Snoqualmie Pass before they demolish the chairlifts and relocate to Camp Muir. I'm no economist, but I know that our snowpack won't truly bite the dust until we get to the latter half of the century.

Credit: Cliff Mass

However, I do have good news for Snoqualmie Pass. I expect them to be open by Thanksgiving. Not only do the models agree with me... climatology agrees with me as well.

Credit: Western Regional Climate Center

The above graph shows the amount of snow on the ground at Snoqualmie Pass throughout the year. I know it isn't the most current graph; but it gets the point across. Around November 1, Snoqualmie Pass starts to build a snowpack, with the snowpack reaching a peak in mid-March and gradually melting away, finally doing so by June in all but the most extreme snow years.

The below graph shows the average snowfall per day. Again, snow generally starts accumulating in November, reaching a peak in January, and decreasing slightly until the beginning of April, at which point it begins to drop off more rapidly, essentially ending by mid-May (though as the blue line shows, there are exceptions!). 

Credit: Western Regional Climate Center

Here is another version that is less precise but is easier to read. It shows the average snowfall at Snoqualmie Pass by month from 1949-2009.

Average snowfall at Snoqualmie Pass per month (1949-2009). Credit: nwBroweather


Finally, here are some satellite pictures of snow depth from NOAA showing how much snow has fallen over the Cascades since our atmospheric river event on Halloween. Credit: National Operational Hydrologic Remote Sensing Center.


Even though a large portion of the Olympics and Cascades have gotten substantial snow, including Alpental and even the top of Summit Central, Snoqualmie Pass itself has yet to see snow. This will change early next week, when an upper-level low will slide into our area and give showers and cool temperatures to the region. Snow levels will fall around 3,000 feet, right where Snoqualmie Pass lies.

Valid 04:00 pm PST, Wed 11 Nov 2015 - 180hr Fcst. Credit: UW WRF-GFS

Additionally, as we continue to get cooler and darker, Eastern Washington will become significantly colder than western Washington, meaning that Snoqualmie Pass will become insulated from warmer Pacific systems sweeping the region when it has an easterly wind, keeping snow levels locally at pass level (or causing sleet/freezing rain). If Snoqualmie Pass did not have this effect, they would get much less snow. Areas near 3,000 feet on the Olympics are generally snow-free for much of the winter, and Snoqualmie Pass is actually colder during the winter than Paradise Ranger Station on Mt. Rainier at 5,400 feet (thank you Mattias Keese for the information). For example, Mt. Hebo in the Oregon Coast Range at 3,154 feet typically only has a couple feet of snow on it at various points throughout the winter, while Snoqualmie Pass averages eight feet by March.

The latest GFS model paints a pretty rainy picture for us through mid-late November, with a large atmospheric river near around Friday the 13th. While models are not good at predicting synoptic weather events more than a week in advance, they can predict trends, and they have been consistent with giving us some pretty wet weather at the end of next week. This precipitation would fall as rain at Snoqualmie Pass, but with a steady parade of storms off the Pacific and temperatures cooling quickly in the higher latitudes, I think that Summit West will be open to burn off some post-turkey calories.

Total accumulated rainfall from 00 UTC 11/5/2015 to 00 UTC 11/21/15. Credit: NCEP

Speaking of snow, the annual Northwest Snow and Avalanche Workshop is occurring this Sunday at the University of Washington. I've actually never gone, but I'm planning on going this year. Hopefully I will see some of you down there!

Cheers,
Charlie

Friday, October 30, 2015

The First Flooding of The Season!

Thursday, October 29, 2015
4:59 pm

Record flooding in Mt. Rainer National Park, November 2006. Credit: National Park Service

For some reason, the weather always seems to get dramatically stormier as soon as we switch from October into November. The weather could be fine for trick-or-treating, and then whammo! November rolls around, and there are more fallen branches and puddles than you can shake a stick at.

This year, our storm season will be arriving early.

From Friday night to Saturday morning, a very juicy front will sit over our area and soak the entire state. The Southern Cascades will get particularly hard hit. This morning's National Weather Service forecast discussion called for over 15 inches in the space of two days to impact the windward slopes of Mt. Rainier. I'm not religious, but I think 15 inches of rain in 48 hours is pretty Biblical.

An ark with all the newest technological innovations! Credit: Kimmo Virtanen

This is a classic atmospheric river event. Atmospheric rivers are streams of moisture in the atmosphere that may be thousands of miles in length but less than a few hundred miles wide, and they are the events most commonly associated with flooding on our local rivers. These atmospheric rivers often occur along frontal zones where there is preexisting uplift, creating precipitation, and they often stall over an area instead of quickly brushing through. The picture below shows a massive atmospheric river stretching well west of Hawaii, and it is going to be plopped right over our area for the next 24 hours and give us a ton of rain in the process.

Valid 09:30 am PDT Fri 30 Oct 2015. Credit: UW Atmospheric Sciences

By tomorrow morning, this river will have moved a bit south, and will be positioned right over our area, giving extremely heavy rain to our region and blustery winds along the coast and on exposed peaks.

Valid 05:00 am PDT, Sat 31 Oct 2015 - 36hr Fcst. Credit: UW Atmospheric Sciences


We had a massive atmospheric river event on November 6-7, 2006, and this event caused record floods on many Cascade Rivers and caused millions of dollars of damage to Mt. Rainier National Park. While this event does not appear to be as devastating as the one we witnessed in 2006, it looks really wet. Take a look at the graphic made by the NWS below.

NWS SEW Current Weather Story

Right now, the National Weather Service forecasters up at Sandpoint are forecasting anywhere from 1-4 inches of rain in the lowlands, 4-8 inches of rain in the mountains, and 12-15+ inches of rain near Mt. Rainier. This will cause flooding on many area rivers, particularly those in the South Cascades. Thankfully, river levels are very low right now and the ground is not very saturated, so this event will not cause major flooding on our local rivers, with the exception of some rivers near Mt. Rainier, particularly the Carbon River.

The heaviest rain will arrive around 10 pm tonight and end around noon tomorrow. Trick-or-treaters may have to avoid some puddles, but they should not be trudging around in the rain tomorrow night.

By the way, after the cold front passes through at lunchtime tomorrow, snow levels will drop to 3,000-4,000 feet, and the Cascades will get significant snow. The Seattle NWS forecast discussion talked about issuing a winter storm watch from Saturday night through Sunday this afternoon, and I suspect they will do that!

Enjoy the fun weather! I'll be posting updates throughout the night on my Facebook page! And by the way, Snoqualmie Falls is absolutely stunning during these flood events. I'd highly suggest going to check it out Saturday night or Sunday morning.

Snoqualmie Falls during a major flooding event, January 7, 2009. Credit: Bdelisle

Stay dry!
Charlie

Sunday, October 25, 2015

An Overview of Hurricane Patricia And Its Relationship To El Nino

Saturday, October 24, 2015
8:09 pm

Visible satellite image of Hurricane Patricia at record intensity approaching the Western Mexico Coast. Taken October 23, 2015. Credit: NASA Terra/MODIS Satellite


Patricia was the deepest cyclone ever recorded in the Western Hemisphere. Deeper than Wilma, deeper than Katrina, deeper than Camille, and far deeper than Sandy (all these storms are named after girls!). She had a central sea-level pressure of 879 hPa, beating out Wilma's 882 hPa central sea level pressure, which was the record for the Western Hemisphere at the time (and remains the record for the Atlantic Basin). These are astonishingly low pressures, and more representative of air pressure values you'd find at nearly 5,000 feet. For comparison, our August 29th summer windstorm, which knocked out power to 500,000 and killed two people, dropped to 986 hPa.

Perhaps even more impressive, however, was how quickly Patricia developed. Wilma took only 30 hours to drop from 982 hPa to 882 hPa, a 100 hPa drop. Patricia did a 100 hPa drop in 24 hours, and was nearly the fastest-developing cyclone on record. Averaged over an entire day, that's a drop of over 4 hPa an hour, and there were undoubtedly times when the rate was faster than that. For comparison, our major windstorms tend to deepen at 2-3 hPa per hour, and do not sustain that rate for very long. The only storm to ever develop faster than Hurricane Patricia was Typhoon Forrest in the Western Pacific.

But ultimately, the most impressive thing about Patricia though was her winds. Even though Patricia was an incredibly intense hurricane, Patricia wasn't all that large. Although this limited the storm surge and range of the damage, it meant that there were steeper pressure gradients within the storm, leading to higher winds. Patricia was estimated to have sustained winds of 200 mph, with higher gusts. For comparison, EF-5 tornadoes have winds of at least 200 mph. So, the strongest winds in Patricia were on par with those found in an EF-5 tornado. That is absolutely mind boggling. When it made landfall, winds were substantially lower at "only" 165 mph, but it still ended up being the most intense landfalling Pacific hurricane on record.

Visible satellite loop of Hurricane Patricia approaching the Western Mexican Coast. Credit: University of Miami's Rosenstiel School of Marine and Atmospheric Science

When Patricia was at peak strength, it had a very small eye that was approximately 8 miles in diameter. Small eyes are indicative of intense hurricanes; Hurricane Wilma's eye was only 2.3 miles in diameter, and it remains the smallest eye ever found in an Atlantic Hurricane. Patricia weakened as it went ashore due to it undergoing an eyewall replacement cycle, which is where a new eyewall forms and chokes off the old eyewall, weakening the storm (but often enlarging it in the process). The satellite loop of Wilma from NASA below shows this extremely well... note how the tiny eye eventually becomes filled with clouds and a much larger eye forms in its place.


Eyewall replacement cycles are extremely hard to predict, and as a result, while hurricane track forecasts have improved substantially over the past decade, intensity forecasts have not. On Wednesday evening, NWS models showed the storm deepening to 950 hPa. They were about 70 hPa off... not very good.

Surprisingly, Patricia did not do much damage, and only 7 deaths have been reported thus far. It ended up striking Cuixmala, a super luxurious and remote eco-resort (Bill Gates, Mick Jagger, George Lucas, and a host of others have stayed here). Cuixmala suffered heavy damages, but because of the compact nature of the storm, the two major cities in the area, Manzanillo to the south and Puerto Vallarta to the north, escaped the worst of the storm. Had Patricia made landfall on one of these cities, the damage would have been far worse.

Hurricane Patricia has been an astonishing example of how El Niño affects hurricane formation in the Pacific. During El Niño events, the greatest warm-water anomalies occur near the equator in the central-eastern Pacific, but these warm-water anomalies extend northward into the subtropics, and this, combined with weaker-than-average trade winds there, gives rise to active hurricane seasons.

Credit: NOAA Office of Satellite And Product Operations

The picture above explains it all. You can clearly see the blob of warm water in the tropical Pacific straddling the equator (not to be confused with our precious "Blob" of warm water in the Eastern Pacific that is slowly dying). However, these anomalously warm waters extend northward across the equator into much of the Eastern Pacific. These warm waters (as hot as 86 degrees where Patricia was forming), combined with little wind shear and high humidity, created an exceptionally favorable environment for Patricia to grow into a monster cyclone, and it didn't disappoint!

Patricia absolutely crushed the Pacific hurricane record for minimum low pressure, which was previously held by Hurricane Linda in 1997 with a central pressure of 902 hPa. As I've stated before, 1997 was the biggest El Niño in recorded history, and the jury is out to whether this current El Niño will surpass that one in strength. But the fact that these two incredibly powerful hurricanes occurred on El Niño years is no coincidence. Strong El Niños have massive impacts on weather around the world, and Hurricane Patricia was a textbook example of that.

Charlie

Saturday, October 17, 2015

What Was the 1997-1998 El Niño Like?

Saturday, October 17, 2015
4:01 pm

Beach erosion by Pacifica, California due to storms during the 1997-1998 El Niño event. Credit: USGS

With all of this talk about the "Godzilla" El Niño of 2015, it's important to remember that an event of this magnitude is not unprecedented. Back during the 1997-1998 winter, we saw the largest El Niño on record, and while the jury is out on whether this El Niño will surpass that one in strength, the effects from this El Niño on weather worldwide are expected to resemble those from the 1997-1998 El Niño. El Niño is not the only factor that decides the fate of our winter, but it is definitely the largest one. Heck, this El Niño was responsible for the destruction of our beloved Blob of warm water off our coast that helped give us 19 straight months of above-normal temperatures.

Therefore, it makes sense to take a look back at the 1997-1998 El Niño and see how the two events have compared thus far. We have weather models to predict our precipitation and temperature anomalies, but climate models do not predict specific events. By looking at the specific events that occurred with the 1997-1998 El Niño, we can get an even better idea of what to expect this coming winter.

Credit: Shrimp News

As this graphic shows, El Niño is truly a global phenomenon. One of the first effects of the 1997-1998 El Niño was a series of devastating wildfires in Indonesia in the summer of 1997. Many Indonesian farmers use slash-and-burn agriculture to create fields, but because Indonesia is so wet, catastrophic forest fires typically do not occur, as the moist soil, summertime downpours, and green vegetation help slow or stop the spread of these fires. However, during El Niño years, convection that typically takes place over Indonesia shifts to the east over the central tropical Pacific, leaving Indonesia much drier and much more prone to these fires. The 1997 Indonesia fires were some of the largest, if not the largest, wildfires in recorded history.

A fire in East Kalimantan province in Borneo, an island of Indonesia. Credit: Global Fire Monitoring Center.

Not surprisingly, 2015 has been a bad year for fires in Indonesia as well. While it has been much better than 1997, nearly 100,000 fires have been detected as of October 15 thus far, more than any other year since at least 2003 (likely 1997, but we did not have satellite fire detection then).

Credit: Global Fire Data

We are on pace to have the worst fire season here since 1997, but as you can see, 1997 was much, much worse. The fires have released over one gigaton of Carbon Dioxide into the atmosphere so far this year, and the season is far from over. That's two BILLION pounds. Think about that. Still, over 8 billion pounds of carbon dioxide were released in 1997, which is more carbon dioxide than the entire European Union emits in a year. Basically, the fires are bad this year, but they are nowhere near as bad as 1997. Thank goodness.

Credit: Global Fire Data

Strong El Niños are also commonly associated with active Pacific hurricane/typhoon seasons due to above-average water temperatures in the tropical Pacific and reduced wind shear. The 1997 Pacific typhoon season (Western Pacific basin) was the most active on record with a record 10 category 5 supertyphoons, and the 2015 Pacific hurricane season (Northeast/Central Pacific basins) has been extremely active as well, with record activity in the Central Pacific. 23 tropical storms have formed thus far, and I have a feeling we will surpass the record of 27 storms set in 1992, also an El Niño year. During late August, there were three major hurricanes occurring simultaneously in the Pacific east of the International Date Line, something that had never occurred in history. It was very impressive, and reminded me of a similar trifecta of storms that was depicted in the extremely realistic climate thriller "The Day After Tomorrow." Meanwhile,  El Niños actually tend to decrease the amount/strength of cyclones in the Atlantic due to increased wind shear, and this year has been no exception.

From left to right, major hurricanes Kilo, Ignacio, and Jimena. Satellite picture taken August 30, 2015. Credit: NASA Earth Observatory
A storm simulation from The Day After Tomorrow. These storms would kill trillions of people and lead to the next ice age. Credit:Climate Change Dispatch

I could go on and on talking about the worldwide effects of the 1997-1998 El Niño. It temporarily warmed the Earth by 1.5 degrees and was responsible for the death of 16% of the world's coral reefs. Although individual places have weather extremes every year, no year in the 20th century was as abnormal worldwide as the 1997-1998 El Niño.

Over the United States, the 1997-1998 El Niño featured wet conditions in the southern states and warm conditions in the northern states, something that is consistent with an active southern branch of the jet stream and a northern branch acting to keep arctic air locked up in central Canada. This is a very typical El Niño pattern, and as a rule of thumb, the stronger the El Niño is, the more probable it is that this pattern will occur. January and February 1998 were the warmest and wettest months ever recorded for the United States, with December 1997 being slightly colder and drier than these two months (but still warmer and wetter than average).

In December 1997, warm and dry conditions dominated the northern half of the country, particularly the northern plains states and the Midwest, as the northern branch of the jet stream prevented arctic air from intruding southward into the U.S. Meanwhile, the southern branch of the jet stream was responsible for cooler-than-average weather in the southeast, with record rainfall in parts of Florida and near-record rains throughout much of the southeast. The Southwest was wet as well, but the effects were not record-breaking (California would go on to have record rains in February). Interestingly enough, the central-southern portions Great Plains and Midwest received above-normal snowfall, as they were cold enough to pick up snow but still had the benefit of the active southern storm track to give them above-normal precipitation.

January 1998 was similar to December 1997 throughout most of the country. Precipitation records were broken throughout the Gulf States, with New Orleans racking up a record 19.28 inches that month. Temperatures in the northern plains, Great Basin, Ohio Valley, and Mid-Atlantic were as high as 10 degrees F above normal for the month in some regions. The Pacific Northwest actually saw above-normal precipitation that month, which is somewhat unusual for an El Niño winter but definitely not unheard of. The Pacific Northwest generally receives near or slightly below normal precipitation in El Niño years. Sea-Tac received 7.15 inches of rain compared to its average of 5.63, and Snoqualmie Pass picked up 149 inches of snow, way above its average of 103.8 for the month.

A powerful, early February 1998 storm that caused flooding throughout California. Credit: NOAA

February was very similar to January and December for much of the nation, with warm conditions to the north and cool temperatures with record rainfall to the south. For example, the average temperature of 29.1 degrees F at Sault Ste. Marie, MI was 15.1 degrees above normal, setting a new record for the warmest February ever. Lake Erie remained unfrozen for only the third winter in history... the last two being 1952-1953 and 1982-1983. Both of these years were El Niño years, and the 1982-1983 El Niño was the second-strongest ever recorded, just being a smidge weaker than the 1997-1998 El Niño. Although the southeast was still wet, California was now making headlines and breaking records as storm after storm pummeled it, causing flooding, mudslides, and substantial beach erosion. Santa Barbara received an incredible 21.74 inches of rain for February alone, setting a new record for the wettest month in recorded history. For comparison, they've only accumulated  20.19 inches since 2013. California would benefit from a lot of rain this year, but the biblical rains they saw in February 1998 caused death and destruction. In other words, let's hope they get really wet, but not really really wet.

A line of tornadic supercells rolling through Florida at 1:55 am. Credit: NOAA

Three weeks later and over 3,000 miles away, the deadliest tornado outbreak in Florida State history occurred. While tornadoes can occur any time of the year (especially in Florida), it is unusual to have them in February. Also, the vast majority of tornadoes that occur in Florida are relatively weak, but this outbreak had several tornadoes that were classified as upper-level F3 twisters. These struck between 11:30 pm February 22 and 2:30 am February 23, and because of their unfortunate timing when many people were sleeping and did not have time to escape, this tornado outbreak is colloquially known as the "Night of the Tornadoes" and remains the deadliest outbreak in Florida history.

In conclusion, the 1997-1998 winter (December-February) was super wet with average temperatures to the south and super warm and relatively dry in the north. The map below summarizes the winter quite nicely.

Credit: NOAA

In this map, the numbers represent how the precipitation total and average temperature of the state compare to 103 years of historical record, with 1 being the coldest/driest and 103 being the warmest/wettest. The northern Plains states and the Midwest were exceptionally warm, with most states either having their warmest or second-warmest winter ever, and many of them were relatively dry as well. The southern states saw more-or-less average temperatures, but they were slightly below average during rainy periods. They were exceptionally wet, particularly in the southeast during December and January and the southwest during February. Here in the Pacific Northwest, we escaped relatively unscathed, and our snowpack was only slightly below normal.

At first glance, it would seem like we should expect very similar conditions for this winter. Both of these El Niños are similar in strength, and they are the main driver of the climate system. However, there are important differences between this El Niño and the 1997-1998 El Niño. For example, the 1997-1998 El Niño was strongest in the Eastern Pacific, while this El Niño was been strongest in the Central Pacific thus far. Additionally, even if the El Niños were identical, the world is different now than it was in 1997-1998. Other oscillations like the Pacific Decadal Oscillations are in different states now than they were during the last El Niño. The world is warmer now than it was back then, with less arctic sea ice. You get the idea.

Still, we've seen fires in Indonesia, a historically active Pacific hurricane season, and catastrophic flooding in the southeast. And this El Niño continues to become stronger. Nobody knows for sure, but preliminary winter forecasts are calling for warm and dry to the north and wet to the south, first the southeast and then California as winter progresses. WeatherOn is releasing an extended winter outlook on November 1st that will cover the entire country, so stay tuned. Spoiler alert: Seattle is going to be colder than last winter.

Thanks for reading!
Charlie

Thursday, October 15, 2015

Why Are Our Evergreens Turning Brown?

Thursday, October 15, 2015
3:52 pm

Every autumn, our beloved deciduous trees shed their leaves, creating an annual economic boom for children everywhere as parents and neighbors pay them the proverbial quarter to rake excess leaves off their lawns. Of course, once these upstart entrepreneurs have reaped the monetary rewards of their labor, they get to romp around in the leaves until they are spread all over the yard again. I would give anything to go back to those days. But since I can't, I'll bore you with a blog on tree biology.

Credit: mastercoaches.com

These types of trees are called "deciduous" trees, while those that keep their leaves all year long are called "evergreens." However, even evergreens do a little shedding, and this autumn, they appear to be more ambitious than usual.

I happen to have a pretty sizable Western Red Cedar in my front lawn, and this bad boy is as brown as I have ever seen it. I took this picture on Monday the 12th, and it really makes you question whether this cedar tree is deserving of the title "evergreen."

Flagging on a cedar tree in my front yard. Taken October 12, 2015

So what's with the brown "flagging" on this Cedar tree? Why are the evergreens doing this so much this year, and will there be any green left for our winter? The answer is yes, and there are two main reasons why.

First, we had a hot and dry summer. Cedars and many other conifers (trees with needles, like Firs, Spruces, Pines etc.) have relatively shallow root systems. This makes them vulnerable to drier and hotter-than-normal summers, as the upper soil responds more quickly to precipitation and heat than the soil deeper down.

A Douglas Fir pulled straight out of the ground at Avery Park, Oregon due to the Hanukkah Eve Storm of 2006. Note how shallow the roots are. Credit: Wolf Read's Storm King Website

This summer, soil moisture was significantly less than average both in the lowlands and mountains, which did not have the benefit of a large winter snowpack to keep the ground moist well through spring. The majority of water loss from a tree occurs through its foliage, so it makes sense that the tree would kill some of these needles to conserve water. If water was low but the tree kept all of its leaves, it would lose even more water, potentially killing the tree. Cedars always flag in the autumn, so the fact that this summer was much hotter and slightly drier (our heavy rains in August made up for much of our deficit) than normal explains why the flagging this year is more prominent than years past.

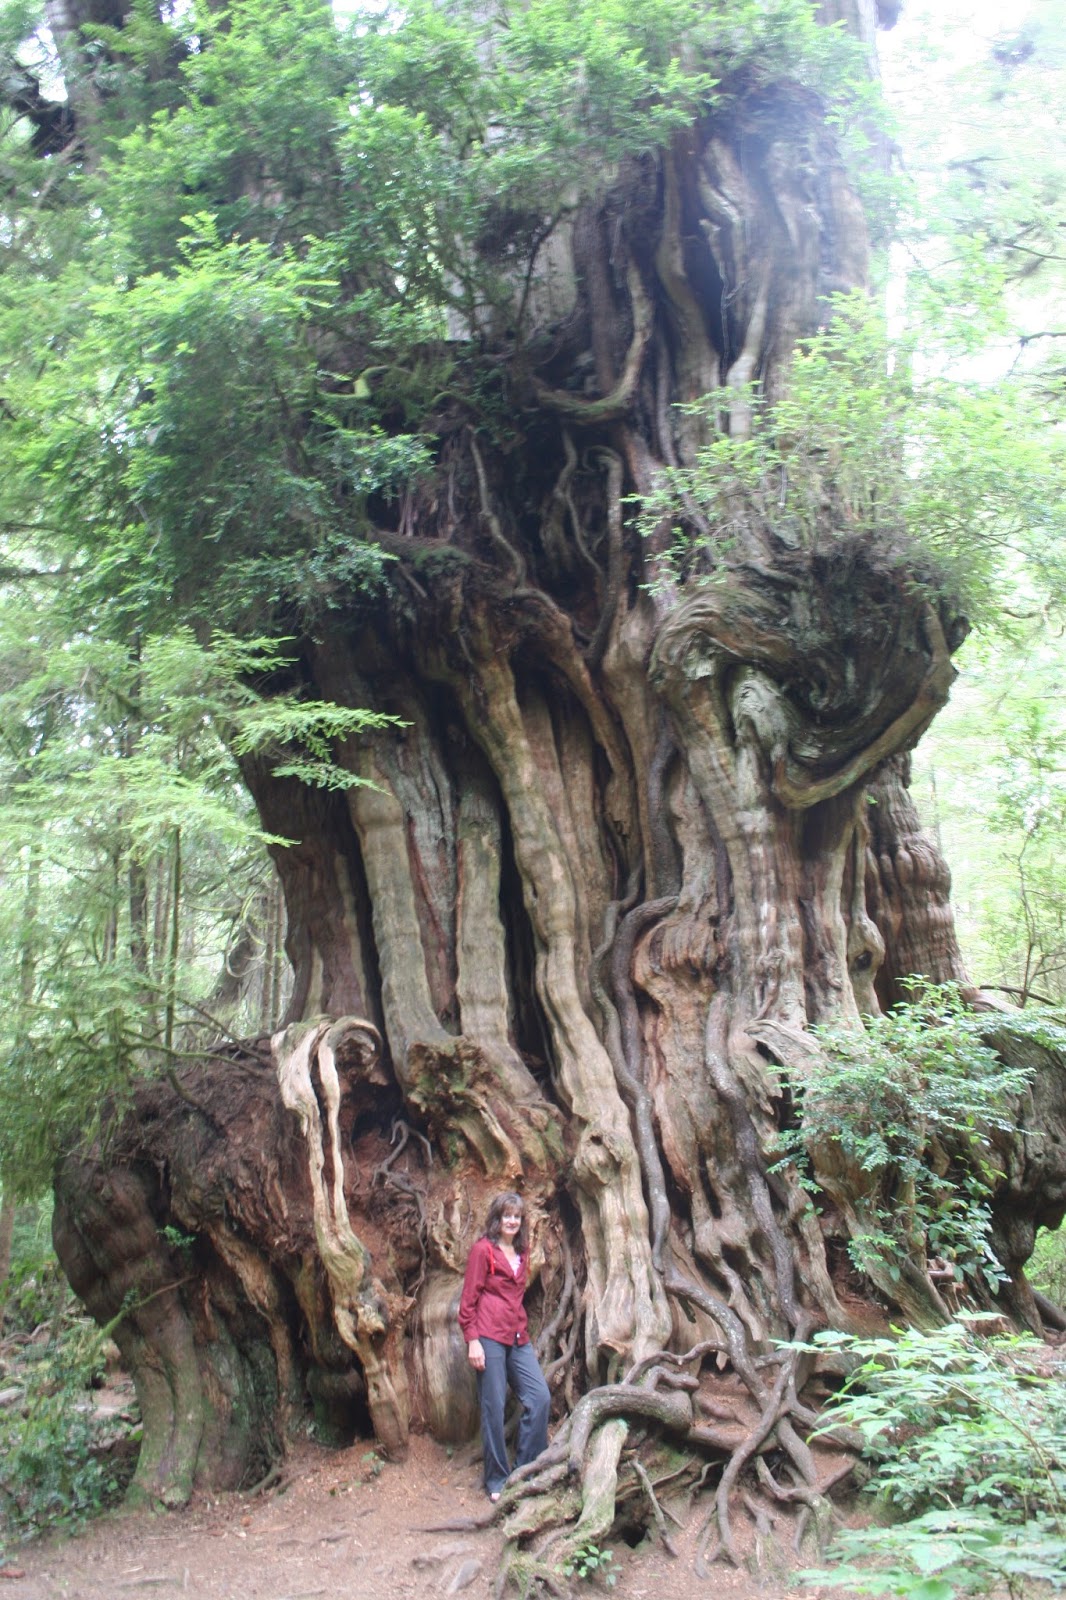
Second, conifers shed old limbs so they can devote more resources and water to growing new ones, meaning that even in the wettest of years, cedar trees still undergo flagging. On average, Seattle only gets 37 inches of precipitation a year, which is approximately the same amount that Dallas gets. If our trees tried to equally distribute water, they would grow very slowly. Trees in the Hoh Rainforest tend to experience less flagging because of the wetter climate, but needles that are several years old still die every year as the tree focuses on new growth, allowing them to grow to unbelievably massive sizes.

"Big Cedar Tree" with a girth of over 66 feet in Olympic National Park. Credit: Tom and Dianne's North American Adventure

Although the term "flagging" is mostly reserved for cedars, most conifers shed old needles in the autumn, particularly after a hot, dry summer.

There are a number of conifers that actually are deciduous. Most of these are Larches, but some Cypress trees and even the Dawn Redwood have this quality. Meanwhile, there are some non-coniferous trees and shrubs that are evergreens. For example, our state flower, the Pacific Rhododendron, is an evergreen shrub.

A Pacific Rhododendron in Olympic National Park. Credit: Walter Siegmund

Hope you enjoyed a different type of weather blog for today! It's fun to mix things up. Keep an eye out for WeatherOn's winter forecast, which will be released on November 1st. Right now, it looks like we are going to be warmer and slightly drier than normal, but nowhere near as warm as last year. I'd still hold off on a seasons pass until the 2016-2017 winter though.

Peace!
Charlie