Monday, September 2, 2013

A Record Heat Wave, but only for Minimums

Thursday, August 29, 2013
2:16 p.m.

Alright, I have to give credit where credit is due. Both Scott Sistek and Cliff Mass, my two favorite weather bloggers in the Pacific Northwest, blogged here and here about how we have seen record nighttime/early morning warmth as of late. These blogs are far better than mine... I suggest you read them. Not necessarily in place of my blog, but, if you really want to learn about the weather of the Pacific Northwest, their blogs are the place on the web to visit.

Now, I know that the phrase "record warmth" may seem a little out to left field for most of you. That's because we are not talking about record maximum temperatures, but because we are talking about record high minimum temperatures. They are the little brother of the record highs we all know and love, and as such, they are often overshadowed by their elder's achievements. But we have been warm at night as of late. I have to admit that, while I did know that our minimums were higher than normal, I had no idea of the magnitude of the departure from average until I took a peek at the aforementioned blogs, and it was probably because I'm still quite familiar with the Micronesia minimums, where you would be jumping for joy if the temperature plunged to 75 and the dew point to 70 because you knew that a restful night of sleep was just around the corner. Let's take a look at the statistics from the past month and see our recorded temperatures versus the averages for this time of year.

The three plots below show the recorded temperatures as compared to the average temperatures for the past 12 weeks. This minimum heat wave is occurring throughout the state. I don't have access to the charts for other Oregon, but you can bet your bottom that it'd look pretty darn similar.

Plots comparing recent data to extremes and averages. SeaTac Airport: Temperatures Over the Last 12 Weeks (GMT). Retrieved from (University of Washington) Live From Earth and Mars - GRAYSKIES - Pacific Northwest Weather Resource website.
Plots comparing recent data to extremes and averages. Walla Walla: Temperatures Over the Last 12 Weeks (GMT). Retrieved from (University of Washington) Live From Earth and Mars - GRAYSKIES - Pacific Northwest Weather Resource website.
Plots comparing recent data to extremes and averages. Quillayute: Temperatures Over the Last 12 Weeks (GMT). Retrieved from (University of Washington) Live From Earth and Mars - GRAYSKIES - Pacific Northwest Weather Resource website.

Just to drive the point home on how consistently warm it has been, take a look as the 2-week chart from Sea-Tac below. It uses the same data as the 12-week chart, but it is zoomed in for optimal viewing convenience.
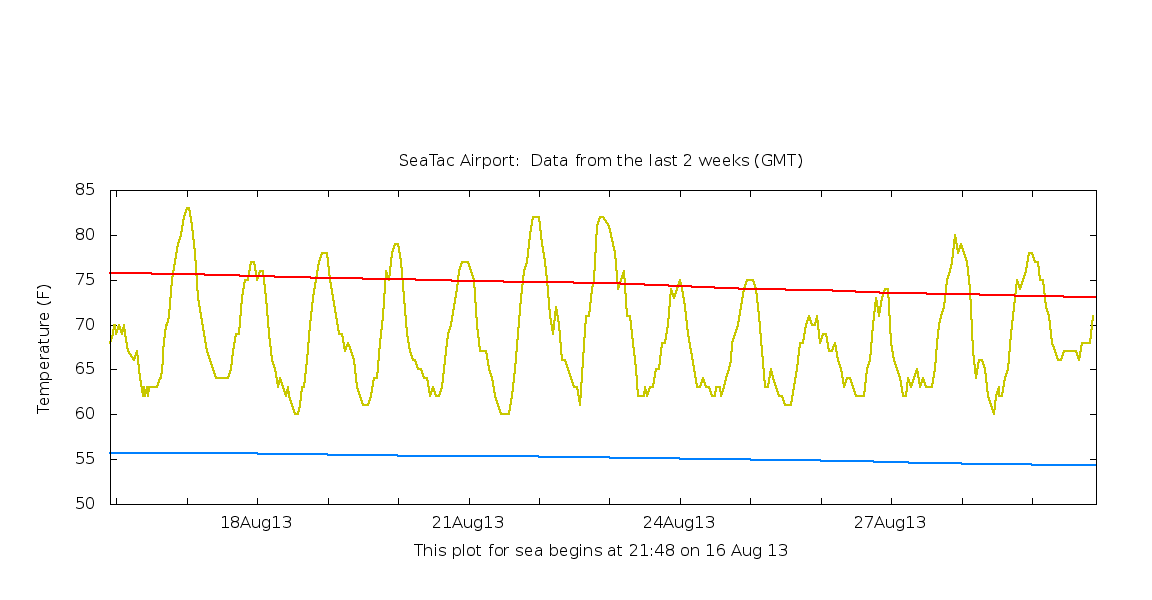
Plots comparing recent data to extremes and averages. SeaTac Airport: Temperatures Over the Last 2 Weeks (GMT). Retrieved from (University of Washington) Live From Earth and Mars - GRAYSKIES - Pacific Northwest Weather Resource website.
I can't ever recall something like this occurring, and neither can anybody else, so if you claim that you can, you're lying. Let's take a look at why this has been happening.

Valid 05:00 pm PDT, Sun 01 Sep 2013: 925 mb Temperature, Heights, and Winds. UW WRF-GFS 12km Resolution: Initialized 00z Sun 2 Sept 2013. Retrieved from the (University of Washington) Pacific Northwest Environmental Forecasts and Observations website

Usually, our winds aloft are northerly, but as you can see in the chart above, they are currently southerly. When we get southerly winds, we get higher dew points (the dew points over the ocean are actually quite low because the water is so cold). Water vapor is a greenhouse gas, which means it is very good at absorbing and emitting infrared radiation, and not all of this infrared radiation is reflected back out to space. Therefore, there is a net "insulating" effect from the high dew points. And these high dew points have also been responsible for the amazing thunderstorms we have seen this summer, most recently in early-mid August for Western Washington. Although we haven't been seeing intense electrical storms 24/7, we have been in a pattern similar to the one shown above for much of the summer, with southerly winds aloft bringing increased dew points into the area. Additionally, we have not had the classic "marine pushes" that we usually see to cool us down because east-west pressure differences have been small due adjacent high pressures over the inland Pacific Northwest and off the West Coast.

The picture below is from the NWS Seattle office and shows the monthly temperature and rainfall statistics compared to average. As you can see, the average low was either the warmest or second warmest on record for every place except Hoquiam.


The previous record at Sea-Tac was 58.4 degrees back in '67. I think it's safe to say we annihilated that record. Measurements used to be taken at the Federal Building downtown, and the record there was 59.1 degrees in July 1941. Credit to Scott Sistek for providing that statistics, which I would certainly spent hours trying to find myself.

Minimums still look below average for the coming week, but not extraordinarily so, and dew points will not get above 60. I suspect this is welcome news for most people. As for me... I've hardly noticed the humidity. Micronesia may have given me humidity discomfort immunity for life.

Thanks for reading!!!
Charlie

Ended Monday, September 2, 2013
1:03 a.m.

Saturday, August 31, 2013

A Solid Day of Rain

Thursday, August 29, 2013
11:48 p.m.

We got a quarter of an inch earlier this month, but we got nothing in July, and I don't recall it raining very hard in June either. I was in Micronesia and it was plenty rainy there, but I don't recall hearing of any torrential rains in Seattle.

And while the rains we saw today were paltry by Micronesia standards, they were Noah-like compared to our past summer. One of my friend's roommates just said there were "rivers on Montlake," to which my friend responded "that sounds like more fun than it probably was." I've seen heavier rainstorms in Seattle, but I haven't seen a dry streak come to such a spectacular end. Of course, we did see some rain in August, so we didn't have an actual streak of consecutive dry days going, but these rains were likely the first of many to follow. I'm not saying we are in for 40 days and 40 nights of rain, so no need to initiate a no-holds-barred search for a male and female specimen of the world's most endangered species... this weekend will actually be quite nice. But it does seem like change is in the air. Rains are becoming more frequent, the days are rapidly getting shorter, and my brother just got settled into his freshman dorm at Whitman. That last one has spawned a quarter-life-crisis of sorts... I'm getting old.

We saw some fairly steady rains throughout Wednesday night and Thursday morning. Our real kicker, though, was this afternoon, when a pretty heavy squall came through Seattle. I check KOMO for much of my weather information (along with the UW, anything affiliated with NOAA, and models that are made by organizations outside the U.S. such as the ECMWF), and at around 4, I saw an alert posted on the homepage that said that extremely heavy rains were currently in Tacoma and were heading northward. I decided to take a look at UW's composite radar loop, and this is what I saw.


There was a pretty decent-sized cluster of storms over Tacoma at this time, and they were heading NNE at  a pretty quick pace. There were also some showers (possibly thundershowers) that had sprung up to the south in the unstable atmosphere that dominated much of Thursday, but the main action was centered around Tacoma at this time.

However, these showers were moving northward at a pretty decent pace. Thirty minutes later, they were entering Seattle.


I actually went outside and filmed the whole thing from an outlook above my house. I saw some brilliant flashes of lightning and got soaked. I actually thought the rain would be heavier than it actually was, and when I took a look at the radar after the storm had passed, I noticed that the heaviest rain had avoided Seattle.


I turned the "opacity" down in the above image so that you could have a better idea of where the heaviest rain was in relation to the physical geography of the area. The heaviest rain was to the northwest and southeast of downtown, while us city folk enjoyed a nice little valley between the peak radar reflectivities. Monroe saw torrential rains... some personal stations reported close to two inches. Here's one of them: The Farm at Woods Creek, Monroe.

Cheryl Monroe, a weather geek friend of mine who lives near Monroe, filmed the below video as a squall was passing through her area. The last time I can remember something this intense in the Puget Sound area was 4-5 p.m. of December 14, 2006. Alas, that was in the Seattle metro area and caused massive urban flooding throughout the region, while this was in a suburb with much better drainage. Still, it doesn't make the intensity of the rainfall any less amazing.


And it's not just the afternoon rainstorms that were newsworthy. There was a supercell over Omak that didn't quite form a tornado but came close. Take a look at the photo below.

Photo Credit: Tim Engh - maintenance supervisor of Omak High School.

Yikes! That would be newsworthy if it was over the plains, let alone Washington.

The SPC (Storm Prediction Center) at Norman, Oklahoma pondered putting a tornado watch over our area but decided against it. I think they made the right choice. I would have liked to see a watch though if for no other reason than being able to take a screenshot of the Seattle NWS page with all the Western Washington counties under a tornado watch. That would be soooo cool.

The NWS posted a photo from the Space Needle that really shows the localized nature of this set of storms.

Retrieved from NWS Seattle Facebook page.

This weekend actually looks beautiful. Bumbershoot's lineup looks fantastic this year, and with perfect weather to boot, the festival should be pretty unforgettable. I'm planning on going... still need to find a way to get a ticket though. Wish me luck!

Thanks for reading, and enjoy the sunny weather!
Charlie

Ended Saturday, August 31, 2013
12:28 a.m.

Thursday, August 29, 2013

Autumn on Your Skin

Thursday, August 29, 2013
12:00 midnight

It's raining, it's pouring, my father, is snoring...

It's been a long time since it has rained. Sure, we saw some rain earlier this month, but with only a quarter-of-an-inch, things dried up extremely quickly. Our garden's been doing fine because we have been diligent in watering it, but all those other plants in the nooks and crannies of our yard are probably figuratively jumping for joy and literally ecstatically existing right now with this rain that has moved into our area. And our grass is far from green. It's pretty hardy though, and even if rain wasn't occurring and nothing was forecast, it'd still find a way of hanging in there.

But the good news is that it is raining. Let's take a look at the most recent composite radar image composed of the Langley Hill and Camano Island Radars.

12:24 a.m. PDT, Thu 29 Aug 2013. UW Northwest Radar Loop.

The rain isn't particularly heavy, but it's significant when you consider how dry we've been lately. And it could get heavier later today.

Let's take a look at our current setup. It's quite complex. Anything would be complex after the weather we've seen recently (even the thunderstorms had a fairly typical setup), but this setup is one I'm not familiar with. With an opening sentence of "WE HAVE QUITE THE SET UP" in their Wednesday 8:40 p.m. forecast discussion, it doesn't sound like the forecasters at the Seattle NWS branch in Sandpoint have a mastery of the current situation either. Don't mind the caps, the forecasters use all caps for everything. Weather really is that important.

 Just like every other NWS forecast office that I am aware of, the Seattle NWS office produces a forecast discussion four times daily, and does so at 3 a.m, 9 a.m., 3 p.m., and 9 p.m. What makes our discussions stand out are our forecasters usage of graphics to help explain their discussions, thus making graphical area forecast discussions.

Check out the picture below. It shows our 500mb height chart overlaid upon a satellite image of the current setup off the NE Pacific. We've got two main upper-level troughs in the jet stream - one off our coast, and one crossing the Aleutians. The one over the Aleutians will act to nudge the trough off our coast further inshore, bringing with it clouds and precipitation. In addition, the air associated with this trough is quite moist and unstable, and convective activity cannot be ruled out across the area as a result. 

Retrieved from 8:40 p.m. 8/29/2013 NWS SEW Graphical AFD


As this trough moves onshore, the height lines will arrange themselves in a way in which the air will tend to diverge aloft. When air diverges aloft, air converges at the surface and rises in an attempt to equalize the change in air pressure due to the divergence. Take a look at the picture below and notice how the lines are not parallel over Washington. Because air rotates counter-clockwise around lows in the Northern Hemisphere, the air ahead of the storm flows from southwest to northeast and does so in a manner that is parallel to the height lines as shown on this map. As the air moves northeast, it diverges in different directions, with the western portions turning northerly and the eastern portions turning easterly.


Valid 02:00 am PDT, Thu 29 Aug 2013 - 9hr Fcst: 500mb Heights, Relative Humidity. UW WRF-GFS 12km Resolution: Initialized 00z Thur 29 Aug 2013. Retrieved from the (University of Washington) Pacific Northwest Environmental Forecasts and Observations website.


Also, notice how high the relative humidities are. According to this chart, relative humidities are pretty darn close to 100 in our neck of the woods as I write this blog at God-o'clock in the morning.


Valid 00z Thu 29 Aug 2013. Quillayute Stuve Radiosonde Sounding. Retrieved from the (University of Washington) Weather Information - framed version website.

The above plot shows how the temperature, dewpoint, and winds vary throughout the atmosphere as measured by a radiosonde launched from the Quillayute Prairie Airport west of Forks Wednesday afternoon. I'm not super good with my correlations between atmospheric pressure and approximate altitude, but I do know that this is a pretty steep drop in temperature with elevation and that the air is pretty humid. Combine this with a significant amount of wind shear, and it becomes noticeable to the trained eye that the air is pretty unstable.

If you can remember from my The Graceful Apocalypse: Part 1 - Basic Thunderstorm Knowledge post, instability is needed for convection, and convection is needed for cumulonimbus clouds and thunderstorms to occur. We may in fact get some thunderstorms today. But before we get into the finer details of how our precipitation will be delivered to us, let's just take a look at how much rain we are supposed to get.

Valid 05:00 am PDT, Fri 30 Aug 2013 - 36hr Fcst: 24-hour Precipitation, 10-meter Wind Speed (Knots). UW WRF-GFS 4km Resolution: Initialized 00z Thur 29 Aug 2013. Retrieved from the Pacific Northwest Environmental Forecasts and Observations website.

Amounts above and below a half inch are forecast over a wide swath of Western Washington lowlands, with the highest amounts inland and south between Portland and Seattle. With the showery nature of this system, some places could receive much higher amounts, while some places may see nary a sprinkle. The orographic effects of the Cascades and, to a lesser extent, the Olympics, will cause heavier precipitation amounts there. According to this model, Mt. Rainier will take home the gold with over 2.5 inches of precipitation. I wonder what the freezing level is.

CAPE (Convective Available Potential Energy) values over the area don't look too impressive per the UW models, but the NWS is calling for values of 1000 Joules/kg over the area this afternoon. I'm not too familiar with CAPE, but apparently 1000 is large for Seattle. I'm sure Oklahomans would laugh at us, but we'll take what we can get.

Here is the NWS' "Active Weather Story." These things sure are helpful.


I have to say though... I'm not entirely sold on thunderstorms happening tomorrow, especially after seeing the CAPE as predicted by the UW models. I wouldn't be surprised if I heard a rumble of thunder, but I'd be bewildered, confused, and exhilarated if all hell broke loose in the afternoon.

The NWS forgot the last part of their last sentence about thunder roaring. The real saying is "When thunder roars, go indoors, get a camera, and go back outdoors." I'm not trying to encourage reckless behavior, I'm just trying to give advice on what I would do. That said, if you sailing, swimming, or just doing something that feels like it might be dangerous in a thunderstorm, better safe than sorry.

~ Charlie

Finished 2:08 a.m.

Wednesday, August 28, 2013

Living Within Epilepsy

Monday, August 26, 2013
3:21 a.m.

Modern science believes that we live in a fabric of space-time with at least four dimensions: three space dimensions and one time dimension. There are additional proposed theories, such as M-Theory which believes there are 11 dimensions, but for the purposes of this post, four dimensions will do.

What modern science does not take into account are dimensions of biology. I'm a shotty scientist on a good day and I took one year of biology my freshman year of high school, but I believe my theory, while perhaps completely nonsensical, is kind of cool. What if there is the "water dimension," or the "sex-drive dimension" that can be observed in all organisms? And then what about higher dimensions in higher-level organisms? Sub-sex-drive dimensions? Dimensions of acceptance? Dimensions of disease? In this proposed theory, all biological dimensions would spring from the Base Dimension - energy from the Big Bang. For example, the Base Dimension would lead to the creation of the Quark Dimension which would lead to the Atom Dimension (I'm skipping a lot of intermediate dimensions so as not to overload the cloud storage of the servers Blogger is run from). From the Atom Dimension, Hydrogen and Oxygen could make the Water Dimension. In a COMPLETELY oversimplified view, the Water Dimension could combine with the Carbon Atom Subdimension to make up the Organic Compound Dimension, which could lead to the Amino Acid Dimension. Billions of years later, the Amino Acid Dimension could have developed into a trillion other dimensions ranging from physical ones like the Homeostasis Dimension to emotional ones like the Love Dimension. Of course, the Water Dimension would always be explicitly required, and every dimension contained within an organism stems from a long chain of previous dimensions. For example, the Apple Dimension stemmed from the Photosynthesis Dimension 2.2 billion years ago. It's like a big family tree (no pun intended!) of dimensions. By now, I've realized that my theory is completely unpractical.

But think about it this way. We all experience the world through these different dimensions I am talking about. Some of us are introverted, while others will do anything to show the world how fantastic they are. Some people are asexual, most are bisexual, with the majority on the heterosexual side (I hesitate to exclusively use homosexual and heterosexual exclusively because love is not black and white).

I have generalized tonic-clonic epilepsy, a subdimension of epilepsy within the mammalian brain, and it's definitely changed my life. The changes are always dynamic, always growing and diminishing, taking on new forms while abandoning old ones. After my first seizure, I was terrified of going down stairs. Now, I don't really care about going down stairs because I know that I'll probably survive even if I break a leg or two. I used to be terrified of death, but after experiencing numerous seizures, death seems a lot less frightening.

People ask me all the time what a seizure is like, and I've always had the same response. Having a seizure is like, at least as well as I can hypothesize, drifting off into death without knowing it, and having a slow, slow increase in consciousness. Each time I have one, it gets harder and harder for me to give an accurate description of what it would be like. There is no "in between" mental state. And I don't get auras, so I have no idea a seizure is coming. 
__________________________________________________________

Wednesday, August 28, 2013
7:23 p.m.

I may have jinxed myself Sunday night. I think I had a small seizure alone in my room on Monday, and I had a much bigger one yesterday while I was running by Husky Stadium. I'll get to that below. First, let's pick up where we left off.

Often times, I'll be in denial when I first regain consciousness after a seizure. There's something very unsettling about being told you have just had a grand mal seizure. And it just seems so hard to believe when I have no recollection of it. Many times I'm later in denial that I was in denial because there is a lag time between me regaining consciousness and me actually being aware of what's going on. It's very strange. I wasn't in denial yesterday though... I felt like I was at an unusually high risk for a seizure because I was dehydrated and decided to go on a ~5 mile run anyway. Definitely a lesson learned there. I sustained some injuries from collapsing onto a gravel road while running, but I'm doing fine now. 

The denial generally fades away with increasing consciousness and when you see the injuries sustained from the seizure if you had any. For example, I have some gashes on my left hand and face and my left arm is messed up... I assume I just fell on it. And then there are the headaches afterwards... worst headaches I've ever had... barely tolerable with even multiple hydrocodone acetaminophen pills. It may have been worsened from a concussion I may have received when my head hit the ground. I know it hit the ground because it was covered in dirt when I came too and I had some bumps and bruises on my face. I almost got a black eye... the bruise was just a tad off. Believe it or not, I've been yearning for a black eye. Black eye = street cred.

But the point of this post is not to make people's hearts break for epileptics. Heartbreaking stories are generally bad... whereas heart-fixing stories are good. And the wonderful thing is that there is a lot of hope for epileptics. Drugs are becoming more effective, scientists are continually making strides in their knowledge and understanding of epilepsy, and society as a whole is becoming more accepting of epileptics. My great aunt had epilepsy that was characterized by frequent absence seizures, and it was something that was never to be spoken of in the family. Now, I freely talk about... even joke about... my epilepsy with friends. I know not every epileptic has this optimistic of an outlook, but hey, there's not much I can do about it, so having a negative outlook would only make things worse.
___________________________________________________________

I never quite understood why famous people who had a certain disease would suddenly donate so much of their time and energy to raise public awareness and money to help fight the disease in some way, shape, or form. It seemed shallow to me for somebody for somebody to start taking public action in response to a disease/infection/syndrome etc. only after they had contracted it. But now I realize the significance behind that. It's not that I think epilepsy is suddenly a bigger problem than AIDS. It's not. But I feel as though I can offer something on behalf of epileptics to the public because I have had these experiences that I would have never imagined epileptics would have to go through. I'm knowledgeable about the disorder I have, and I feel as though that helps me become a more effective proponent for justice, treatment, and equality in society today. Before, all I knew was that I wasn't supposed to play video games if I have epilepsy. Thankfully, my type of epilepsy is immune to flashing lights, so I can play all the SEGA Bass Fishing Duel I like. It's the first game I learned to play on my PS2, and I can't recommend it highly enough.


Retrieved from "The Iso Zone" website

Most of the stipulation for me writing this particular blog comes from my Micronesia trip and how the UW International Programs & Exchanges Department handled my situation. That was the first time I felt completely different from everyone else. There's that whole not-allowed-to-drive thing, but I honestly could care less about that because I love to walk and run all over the city and take the bus during the school year (we get free access to Seattle Metro). When I was in Micronesia, I wasn't allowed to partake in certain activities, and that made me feel different. It wasn't anything new though... I had felt different ever since I first got that letter from the UW attempting to slyly convince me not to go. But when the UW demanded that my mom fly over to be my "emergency evacuation escort" and denied me the chance to stay even with the teacher's and doctor's approval, I felt like I lived a world away from everybody else.

But even being forced to leave Pohnpei was OK, because I had the time of my life in Hawaii with my mom as we switched plane tickets and had an "emergency evacuation vacation."

I've posted a link to The Epilepsy Foundation at the top this blog (not the individual post) in hopes that some readers (and myself) will take a look at it. The foundation's mission statement is to "ensure that people with seizures are able to participate in all life experiences; and to prevent, control and cure epilepsy through research, education, advocacy and services."


I don't "live with epilepsy" in the same way that people don't "live with time." They live within time, and I do so with epilepsy. It's just another one of those gajillion dimensions in which we experience the world. And I'm perfectly comfortable here.I just hope I can help others feel the same.

Thanks for reading. If you know anybody with epilepsy and you'd think they'd like this post, go ahead and show it to them! Or anybody in general. This is my personal blog, and believe it or not, I'm not always thinking about the weather.

Charlie

Finished Wednesday, August 28, 2013
9:48 p.m. 

Monday, August 26, 2013

SST Anomalies vs. Psychological Fortitude

Thursday, August 22, 2013
12:19 p.m.

People always want to know what the upcoming late autumn and winter weather will be like. Of course, it's impossible to predict individual storms so far out in advance (but that doesn't make the Old Farmer's Almanac any less entertaining), but it is certainly possible to make some general predictions of the type of weather any one place might see. Solar activity cycles and oceanic temperature oscillations are just a few of the characteristics forecasters take into account when making long-term predictions. Of course, if you look in the super long term, forecasts become more based on greenhouse gas concentrations than anything else, but their impact right now is low compared to natural variability (except in the arctic summer). The world will be a completely different place 100 years from now

By far the most notable pattern I'm aware of that affects weather season-to-season is the state of the equatorial waters of the eastern Pacific as a function of El Nino Southern Oscillation (ENSO). There is a general cycle of warm and cool SST in the eastern Pacific, and these phases are called El Nino and La Nina phases, respectively. They both occur every 3-5 years and usually (but not always) oscillate. When the SST in the eastern Pacific are average, we say that the ENSO is in a "Neutral" phase. It looks like we will, just like last year, be in a solid Neutral phase for this upcoming winter.

Occasionally, I do blog "projects" as opposed to blog "posts," and I did one such project about ENSO back in 2012. I'd recommend giving it a thorough read before the rest of this post so that you can better understand how ENSO works, but I thought I'd just give a brief review of the effects of El Nino, Neutral, and La Nina events over North America.

El Nino Conditions. Retrieved from the NWS' Climate Prediction Center website

When there is a strong El Nino, the Eastern Pacific High, a semi-permanent ridge of high pressure in the Eastern Pacific, gets "less high" (weaker). When it does this, the jet stream off the Pacific shifts south and tends to deliver an endless barrage of storms to California, while the polar jet stream stays well to our north, leaving us in "no man's land" between the two jet streams and giving us warm and dry weather. That's right... folks in L.A. get all these massive cyclones while us Pacific Northwesterners are mere spectators. I hate El Nino winters for a variety of reasons... far too many to count. Upwelling along the Pacific Coast is reduced, so the fishing sucks, and skiing generally ranges from adequate to horrible.

La Nina Conditions. Retrieved from the NWS' Climate Prediction Center website.

La Ninas are actually pretty cool. We are generally wetter and cooler than normal, and since upwelling is increased along our coast, salmon get big and healthy. Instead of having one persistent Pacific jet stream to our south and an polar jet way up north, a big ridge of high pressure over the Eastern Pacific acts to split one jet stream into separate Pacific and polar jets; just like a rock in a river pushes water to either side of it. The Pacific jet stream doesn't usually get super strong, so while we may remain in a wet and cool pattern, we usually don't get big honkers of storms.

But Neutral... that's where things start to get interesting.


Neutral Conditions. Retrieved from the NWS' Climate Prediction Center website

Neutral years tend to be highly variable. Sometimes, the Eastern Pacific high will retrograde to the west and allow the polar jet stream to come into our area, giving us cold, snowy conditions. Our last significant arctic outbreak was during the winter of 2008-2009, which was a Neutral winter. Our last major windstorm (the Hanukkah Eve Storm) for Western Washington was in December 2006, which was actually a very weak El Nino year (there was an even bigger one in December 2007 (The Great Coastal Gale), a La Nina year, but this only affected this coast). November 2006 was straight-up insane and was the craziest month that I can ever remember for Seattle weather (rumor has it that the entire 1861-1862 winter was off the hook, though). Sea-Tac got 15.63 inches of rain, crushing the previous January 1953 record of 12.92 inches, and we tacked on some thundersnow at the end of the month. Take a look at the picture below, and you'll see that there is a very clear correlation between windstorms and Neutral years.

Sea-surface temperature anomalies over the eastern tropical Pacific (Nino 3.4 region) for November
through February. Years with major windstorms are indicated by red squares, with non-windstorm years
shown by blue diamonds. It appears that major windstorms avoid El Nino and La Nina years. Retrieved from UW Atmospheric Sciences website. Credit: Cliff Mass

On the other hand, last winter was also a Neutral winter, and I essentially dozed off to sleep.
_____________________________________________________
 
I have a habit of making mathematical analogies for essentially everything... a skill I no doubt picked up from Mikko Nynas, some weird Scandinavian 70's transplant guy who thinks we're friends. I was thinking about the strength of an El Nino/La Nina in terms of temperature departures from average in the Nino 3.4 Region, the main region meteorologists use for forecasting and observing the current state of ENSO, and how this corresponded to the easiness of a seasonal forecast. I ended up graphing the hyperbolic function 1/x to approximate the uncertainty a typical Pacific Northwest forecaster has as a function of SST departure from average in Nino region 3.4.

We just missed the Mukilteo/Clinton ferry by one car.

Anyway, let's get back to mathematical representations of psychological fortitude as a function of how warm the water is 5,000 miles from here.


I let the x-axis equal the departure from normal of the SST in degrees Celsius, and I let the y-axis correspond to the uncertainty of long-term forecasters in second-guesses per hour. As the temperature anomaly increases, forecasters second-guess themselves less and less per hour. This is actually not desirable, as the forecaster's brain activity will slow down more and more until they are a neuron away from entering a vegetative state.

The opposite is not desirable either, though. If the anomaly becomes closer and closer to 0, the forecaster will second-guess himself more and more. Soon, he will be second-guessing himself so much that his body will go into overdrive in an attempt to keep up with his ridiculously flippity-floppity mind. His pulse will reach millions and millions of beats per minute, and because his basal metabolic rate will be so high and he will have such a caloric deficit, he will evaporate into air until only an infinitesimally small quark exists.

Will I vegetate, evaporate, or somewhere in between? Let's take a look at the current SST.

Tropical Pacific Measured SST and anomalies. Week ending Aug. 14. Retrieved from NOAA CPC (Climate Predoctopm Cemter)

As you can see, the temperature is close to average in the Eastern Pacific. It looks to be half a degree lower, but this anomaly has been getting smaller, and and in any event, a 0.5 degree anomaly is not large enough classify the current status of the equatorial Pacific to classify an event as a La Nina event.So I think I'll have a nice, healthy degree of uncertainty... enough to keep me blogging, but not too much that I'll forget to take joy in all the other aspects of life.

Speaking of forgetting to take joy in all the other aspects of life... I've been laboring days and days to try and find what the integrals and derivatives of this function mean for forecasters, but I haven't been able to find any. If anybody has any ideas on what ln(x) or -1/x2 represent, let me know. That includes you, Mikko.

Peace!
Charmander

Finished Monday, August 26, 2013
12:55 a.m.