Tuesday, November 15, 2011

A Response to the Deniers of Anthropogenic Global Warming

Tuesday, November 15, 2011
12:43 P.M.


In a nationwide survey of 1,010 American adults taken in May 2011, only 47% of Americans believed in human-caused climate change. In this blog post, I will provide indisputable evidence that our climate is getting warmer, and humans are the cause. Anthropogenic global warming theory is grounded in solid scientific evidence. Since 2007, no scientific body of national or international standing has maintained a dissenting opinion on climate change. The last body to hold a dissenting opinion was the American Association of Petroleum Geologists.

Americans are misinformed about climate change because the people they look up to hold onto incorrect assumptions about human-caused climate change. One of the most embarrassing statistics is that according to a 2010 CBS News Report, only 31% of television meteorologists believe in global warming. This is embarrassing and shameful for the meteorological community. Additionally, many contemporary politicians deny global warming to push their own economic and social agenda, and do so without any solid evidence to back it up.

First, I'll explain some common climate myths, and I will debunk them with science.

MYTH #1: The climate has changed before, so it is impossible to tell whether humans are contributing to climate change.

This is one of the biggest myths in the climate change denial industry. The climate has certainly changed before, but it has always been in response to a certain external force. If the sun emits less radiation, the earth cools. If volcanoes emit particulate matter in the air, the earth cools at first, and then warms due to the greenhouse gases emitted by the same volcanoes. Currently, the atmosphere is experiencing an external force - the anthropogenic emission of greenhouse gasses, most notably carbon dioxide, into the atmosphere. In the past, an increase in carbon dioxide has led to an increase in temperature. In the future, we can expect the same thing to happen.

One of the ways we can correlate past external forces to changes in temperature is to look at ice cores. The diagram below shows some characteristics in ice cores from Vostok, Antarctica. In the graph below, the first blue graph shows Carbon Dioxide concentrations, the red graph shows average temperature, the light green graph shows Methane concentrations, and the light orange graphs show the relationship between O18, an isotope of Oxygen, and solar radiation. Looking at the graph, it seems like the most 018 appears when solar radiation is the highest. CO2 (Carbon Dioxide) and CH4 (Methane) are both greenhouse gasses, you can see a strong correlation between them and the average temperature of the earth


Now, look at the current CO2 and CH4 measurements from the top of Mauna Loa.

The highest CO2 concentrations shown over the past 436,000 years are around 280-300 ppm. For September 2011, CO2 concentrations at Mauna Loa were 389 ppm. Vostok does not take current CO2 measurements.


Historical Methane values at Vostok reached slightly over 700 ppb at their peak, and now, they are 1800 ppb.

To wrap it up, climate change has happened before, but because we have evidence of how it happened, we can theorize how the changes we make in the earth's atmosphere will affect the climate. Since we have added so many greenhouse gases to the atmosphere, and the ice cores show us that increased concentrations of greenhouse gasses are associated with warming, we can hypothesize that the Earth will warm.

MYTH #2: It's the sun's fault!

While the sun clearly plays a huge role in the temperature of the Earth, the sun's solar radiation has, in recent times, stayed relatively constant. Meanwhile, the temperature of the Earth continues to rise. 
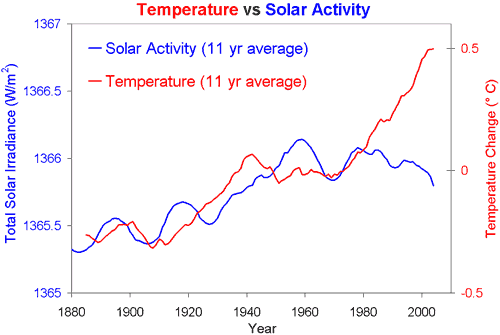

Up until about 1980, the solar radiation and temperature of the Earth followed each other pretty closely. Since then, the temperature has increased significantly, even when the sun's radiation has remained pretty much the same.

MYTH #3: It won't get that bad.

Perhaps the scariest aspect of climate change is an effect known as positive feedback. In terms of global warming, positive feedback means that as the earth gets warmer, other effects will be triggered that will increase the warming further. 

One example is an increase of water vapor in the atmosphere. Water vapor is by far the most potent greenhouse gas, and as the temperature warms due to our greenhouse gas emissions, more water will evaporate from the oceans, warming the atmosphere even further. 

Another positive feedback is when snow melts. Snow reflects much of the Earth's radiation back to space, but when the snow melts, this radiation is absorbed by the Earth, and the Earth warms. Take a look at how much sea ice has melted over the north pole in recent years. The melting of sea ice will only accelerate warming. 


MYTH #4: There is no way to effectively forecast a warming climate because we can't get next week's forecast right!

The latter part of this statement is actually true, particularly here in Seattle when the word "snow" pops up in the weather forecasts. Heck, sometimes we can't get next day's forecast right. Climate models, however, forecast trends over time, not specific weather conditions at a specific time, and they have proven to be very effective in doing so.

The diagram below shows the three model simulations of the past 140 years compared the measured temperatures. Model a only shows the predicted temperature for the natural forces on our climate, such as solar radiation. Model b only shows the predicted temperature for the external forces than humans have imposed on the atmosphere. Model c combines the two. Model c is pretty darn accurate.


Now that we've established that climate models are pretty accurate, let's look at some for the future. 


These climate models vary because they are based upon different levels of greenhouse gasses emitted by humans into the atmosphere over time. If we really clean up our act, we will likely see a scenario akin to B1. If we do a little bit of work, but not a whole bunch, we will see a scenario similar to A1B. If we continue going the way we are now, we will see a scenario like A2. Most places see significant warming, especially the arctic. There is no cooling anywhere.

I also want to just brush on "global cooling" for a moment. Many of you have seen this movie...


It's one of my favorite movies, but it is completely false. Basically, they saw that the change in salinity in the ocean due to the melting of polar ice caps will cause the North Atlantic Current to shut down. This will not happen. Studies show that the current actually gets stronger as the Earth warms. Yet another positive feedback!

MYTH #5: The Earth is no longer warming!

This is the last major myth I want to address, and it is one of the biggest misconceptions about global warming. Let's take a look at a graph of average temperature anomalies for the Earth since 1950.


You can see that there are times where the Earth does not warm as much as others, and there are times when it even cools. Since 1998, the Earth's temperature has remained relatively constant. 

However,  you can see that there is a clear upward trend in temperature. Right now, since the effects of global warming are relatively weak compared to what they will be in the future, the natural climate cycles of the Earth tend to balance out anthropogenic global warming from time to time. Eventually, though, the forces of man-made climate change will overpower the natural variations of the Earth, and these periods will become shorter and less frequent.

If there is any good news about this, it is that the Pacific Northwest will be one of the last places to experience global warming because of its proximity to the Pacific Ocean. The warming here, however, will still be significant, especially as we near the 22nd century. The high resolution forecast models based at the UW have modeled changes in temperature for our specific region. Let's take a look at them.

All of these maps show the predicted changes in surface temperature during the winter months from the 1990s to a specific decade in the future. 

At first, the warming isn't too significant


Even at 2050, the warming isn't too bad. The mountains are warming up faster than the lowlands because snow is melting on them and creating a positive feedback.


By 2090, though, the Pacific Northwest has warmed significantly. It's pretty sobering.


These models also forecast the snowpack in the mountains. Take a look at the forecast water content of snow at Stampede Pass for several different time periods.

You certainly won't be skiing at Snoqualmie Pass by the 2090s! 

Ironically, the snowpack in the Cascades has stayed relatively constant the past 30 years or so. As anthropogenic global warming continues to grow in scope, though, we will see a clear downward trend that will accelerate over time.

I blasted through this post in less than two hours, as I am a busy college student and I have work to do. I apologize if I have any typos. I feel very strongly about the fact that humans are causing climate change, and this post is an attempt to provide substantial evidence to support my views. Global warming should not be a debate at this point. It is inevitable, and it will have serious repercussions throughout the world. 

If you have any thoughts on this post, comment below! I look forward to hearing your opinions.

Thanks for reading this particular post, it means a lot to me
Charlie

Monday, November 14, 2011

The Convergence Zone that Keeps on Giving

Monday, November 14, 2011
6:12 P.M.

Weather Radar from the NWS at 9:06 A.M. PST

The Puget Sound area commonly gets strong convergence zones in the winter, but I have never seen one as persistent as the one that happened today. This convergence zone brought tons of snow to the central slopes of the Cascades, and eastbound Snoqualmie Pass was even closed at one point. Meanwhile, places like Crystal Mountain, outside of the convergence zone, received very little snow today.

Look at some of these tables for the weather today as recorded at Crystal Mountain and Alpental, near Snoqualmie Pass.  Snow levels were below pass level all day today, so to estimate the amount of snow recorded, I took the water equivalent and multiplied it by 10, since one inch of rain is approximately equal to one inch of snow most of the time.

11-14-2011
Northwest Weather and Avalanche Center
Crystal Mountain Ski Area, Washington

Total snow may read bushes

 MM/DD  Hour  Temp  Temp    RH    RH  Wind  Wind  Wind  Wind  Hour Total 24 Hr Total
         PST     F     F     %     %   Min   Avg   Max   Dir Prec. Prec.  Snow  Snow
             6830' 4570' 6830' 4570' 6830' 6830' 6830' 6830' 4570' 4570' 4570' 4570'
------------------------------------------------------------------------------------
 11 13  1900    24    30    99    98     6    15    39   248     0     0     5    14
 11 13  2000    25    30   100    99     8    21    40   285     0     0     5    14
 11 13  2100    25    30    99    99     6    17    33   173     0     0     6    14
 11 13  2200    24    30    99    99     7    18    42   294     0     0     6    13
 11 13  2300    25    31    99    99     7    19    44   306     0     0     6    14
 11 14     0    23    31    99    99    11    23    46   319   .01   .01     6    13
 11 14   100    22    30    99    97     8    22    42   346     0   .01     6    14
 11 14   200    23    31    99    89    11    29    49   318     0   .01     6    13
 11 14   300    23    31    99    88    11    30    54   339     0   .01     6    13
 11 14   400    22    30    99    95    11    26    54   316     0   .01     6    13
 11 14   500    23    30    99    96     9    22    37   265   .01   .02     6    14
 11 14   600    22    30    99    96     9    23    49   298   .02   .04     6    14
 11 14   700    22    30    99    96    15    30    50   292   .01   .05     6    14
 11 14   800    22    30    99    95    11    29    54   140   .02   .07     6    14
 11 14   900    22    30    99    93    13    29    52   315     0   .07     6    14
 11 14  1000    23    31    99    88    13    28    46   249   .01   .08     6    14
 11 14  1100    23    30    99    90    16    31    44   258   .01   .09     6    15
 11 14  1200    21    29    98    86    16    30    47   266     0   .09     6    14
 11 14  1300    21    30    98    82    12    29    54   263     0   .09     6    14
 11 14  1400    20    29    98    85    10    27    52    47   .01    .1     6    14
                20          98           2    19    39   296


                                                                       Total
                                                                       Prec.
                                                                       4570'
    ------------------------------------------------------------------------
                                                                          .1 

.1 inches of precipitation is not that impressive. The winds, on the other hand, are pretty strong! Mission Ridge, on the eastern side of the Cascades, had a wind gust to 96 miles per hour yesterday. Cliff Mass did a fabulous blog post on these strong winds, and you can find this post here.

Snoqualmie Pass, in the convergence zone, received much more snow. The gauge at the pass was malfunctioning, so I used the gauge from Alpental, which is a ski resort adjacent to the pass.


11-14-2011
Northwest Weather and Avalanche Center
Alpental Ski Area, Washington

Wind gages unheated and may rime
24 hr snow gage not yet iunstalled
Total snow may read bushes

 MM/DD  Hour  Temp  Temp  Temp    RH    RH  Wind  Wind  Wind  Hour Total 24 Hr Total
         PST     F     F     F     %     %   Avg   Max  Dir. Prec. Prec.  Snow  Snow
             5470' 4350' 3100' 3100' 5470' 5520' 5520' 5520' 3100' 3100' 3100' 3100'
------------------------------------------------------------------------------------
 11 13  1900    27    31    34    98    98     0     0   288   .03   .03     2    19
 11 13  2000    27    31    34    99    99     0     0   287   .02   .05     2    20
 11 13  2100    27    31    34    99    99     0     0   287   .04   .09     2    20
 11 13  2200    27    31    35    97    98     0     0   287     0   .09     2    18
 11 13  2300    27    31    33    99    99     0     0   287   .06   .15     2    19
 11 14     0    27    30    34    98    99     0     0   287   .01   .16     2    19
 11 14   100    27    31    34    98    99     0     0   287   .01   .17     2    19
 11 14   200    27    30    33    98    99     0     0   287   .04   .21     2    20
 11 14   300    26    30    33   100    99     0     0   287   .08   .29     2    20
 11 14   400    26    30    34    96    99     0     0   287   .02   .31     2    20
 11 14   500    26    29    33    99    99     0     0   287   .07   .38     3    20
 11 14   600    25    29    33    99    99     0     0   287   .06   .44     3    19
 11 14   700    26    29    32   100    98     0     0   285    .1   .54     3    17
 11 14   800    25    29    32   100    99     0     0   283   .15   .69     0    14
 11 14   900    24    28    32    99    97     0     0   285   .15   .84     1    19
 11 14  1000    22    26    30    99    98     0     0   287    .1   .94     2    19
 11 14  1100    22    26    30    99    97     0     0   290   .07  1.01     3    20
 11 14  1200    22    26    32    99    98     0     0   287   .05  1.06     4    19
 11 14  1300    22    26    31    98    97     0     0   287   .02  1.08     4   -25
 11 14  1400    22    26    31    98    97     0     0   287   .03  1.11     5    21


                                                                       Total
                                                                       Prec.
                                                                       3100'
    ------------------------------------------------------------------------
                                                                        1.11

1.11 inches of precipitation! That is astonishing, even for a strong convergence zone. The temperatures for the most part were slightly above, at, or slightly below 32 degrees, so I have a feeling the snow here would be wetter and have more of a 1:8 inch ratio of water to snow. Even though the temperatures were above freezing for a while, it was likely still snowing at the pass, as snow will often continue to fall 1,000 feet below the freezing level, especially when the atmosphere is unstable and the temperature varies rapidly with height, as it has over the past day.

The main convergence zone action occurred from around 6 A.M. this morning to 2 P.M. Believe it or not, a convergence zone is still going on and is located slightly south of Snoqualmie Pass. Take a look at the radar loop from 6 A.M. to 2 P.M. today, and notice the persistent convergence zone action over Snoqualmie Pass.


The Summit at Snoqualmie, which is typically one of the last places to open for the ski season due to its low elevation, may end up being one of the first areas to open because of this convergence zone dump. In addition, we will likely see plenty more convergence zones in the following week as we will be under a moist, cool northwesterly flow that is conductive to these zones. The snow at Snoqualmie will continue to pile up.

Many people have asked me about snow in the lowlands this coming weekend, and although the mountains will get heavy snow down to low elevations, I doubt we will see snow to the surface. We will not see enough arctic air in our area to see snow in the lowlands. This could change though, and if it does, I'll let you know!

Back to homework. Thanks for reading!
Charlie

Saturday, November 12, 2011

Yesterday's Weather, Turning Colder

Saturday, November 11, 2011
1:59 P.M.


Before I elaborate on what I think the weather will be like, I'd like to point out the strength of the front we saw yesterday. Yesterday's front wasn't big and didn't produce a whole bunch of rain, but it was strong and consolidated, and it really packed quite a punch. Look at that picture above! That's a beautiful front. We never were able to get these types of pictures before our coastal radar.

The most interesting weather yesterday, however, occurred after the front passed. There was an abrupt wind shift from southerly to northwesterly, and once these northwesterly winds hit the Olympics, they split and later converged over the north Seattle to give us heavy rain, lightning, and even hail via the famous Puget Sound Convergence Zone.

Take a look at this UW time-lapse shot from the atmospheric sciences building yesterday, and look at the huge wind shift in the late afternoon. It occurs around 3:50 P.M. After the wind shifts, you can see convective motion at the base of the clouds, and rain starts falling 45 minutes later in a Puget Sound Convergence Zone.


This convergence zone strengthened, and Seattle got some particularly exciting weather around 5:30. My Lander 8 floor-mate Jane Kwon was out grocery shopping at the time. She sent me a text at 5:35 P.M. telling me she heard a huge clap of thunder, and then sent me another text at 5:38 letting me know that she was now getting hailed on. If only Jane Kwon had looked at the radar imagery beforehand...

Here is some hail from Kirkland. Photo by Jan Moser, taken from KOMO News.


Meanwhile, places to the north and south were experiencing dry conditions. Check out this picture by Mukilteo last night. Scott Sistek took the photo and I retrieved it from KOMO News.


You can see some cumulonimbus associated with the convergence zone, but Mukilteo is completely dry! Pretty amazing.

Now, let's get on to the forecast.


Here are the current weather advisories over Western Washington as of 8:00 P.M. Saturday evening. The western slops of the Cascades are getting hammered with snow, and thus are under a winter storm warning for 8-16 inches of snow. The Olympics are under a winter weather advisory for lesser snowfall amounts, and the Strait of Juan de Fuca and coast have gale warnings while the sound and San Juans have small-craft advisories.

Right now, the snow is the big story, and the NWS office at Seattle made a little nifty graphic to show this.


I like this guy, it's simple, informative, and gets the job done. Let's take a look from Snoqualmie Pass earlier today, though, so we can really sense how snowy it is out there.


The snow will continue to pile up in the Cascades tomorrow while the Seattle area experiences post-frontal instability showers. These showers will become weaker and more isolated by Monday, and much of Tuesday may actually be dry.

Wednesday, however, looks stormy, and this storm could very well decide if I have to forecast the "s" word for Seattle in my next blog.

Valid 10:00 am PST Wed, 16 Nov 2011 - 90hr Fcst - UW 00z 12km WRF-GFS SLP, 10m winds, and temp

Midday Wednesday, a compact, strong low pressure system will storm into our area. This particular system could give some good gales to the coast, and if it came closer, it could give us some pretty strong winds. For now, it doesn't look to cause us too much damage wind-wise. However, it will pack a lot of rain and mountain snow. 

More importantly though, it will usher in a new weather pattern for us. After this storm passes through, we will get cold. Some models are saying we will get cold enough for snow, while others are saying we will see more of a rain-snow mix. The stronger this storm is, the better it will be at digging a trough in the jet stream and pulling down modified arctic air into Western Washington.

In this scenario, the low brings down quite a big of cold air!

Valid 01:00 pm PST Thu, 17 Nov 2011 - 117hr Fcst - UW 00z 36km WRF-GFS 1000-500mb thickness, SLP

At this point, it looks like we could see some pockets of lowland snow next weekend, but I'm not forecasting a wide-reaching lowland snow event at this point. It is just too early. I'd like to see the rest of this run and check out the European and Canadian models before I make any assumptions. It will definitely get much colder though, and the snow will continue to pile up in the mountains. Happy La Nina year everybody!

Charlie

Wednesday, November 9, 2011

The Perfecter Storm

Wednesday, November 9, 2011
6:29 P.M.


That, my friends, is the strongest mid-latitude cyclone to impact the U.S. in 40 years. There have been plenty of strong storms to hit the United States, with the Hanukkah Eve Storm of 2006 and the Great Coastal Gale of 2007 recently impacting our region, with the eastern half of the United States experiencing the "Storm of the Century" back in 1993, which was very intense as well. I don't know if it was the storm of the century, though. If I had to choose the strongest storm to impact the U.S. in the 20th century, I would choose the Columbus Day Storm of October 12, 1962.

There is one particular storm that annoys the heck out of me, though. Not because it was a weak storm, but because it is the most overrated storm to ever impact the U.S. I'm talking about the "Perfect Storm" of October 31, 1991.

Take a look at this satellite picture, and tell me how wimpy this storm looks.


The "Perfect Storm" was actually a weak category 1 hurricane. The low currently in Alaska has widespread sustained category 1 or 2 hurricane force winds, and these winds cover an exceptionally large area. The low pressure from this storm bottomed out at 943 millibars, a pressure commonly associated with a category 4 hurricane.

Red Dog Dock, in the northwestern part of Alaska, is just one place that is being pounded by this storm. Check out the pressure and winds below!


Gusts to 80 knots! Amazing. This is not an isolated incident... winds like this have occurred throughout Western Alaska and are continuing further north.

The most incredible thing I have heard from this storm, however, is the accretion of rime ice. One coastal station peaked at a rate of 23.5 inches of rime ice per hour.


Waves are huge, a 10 foot storm surge is hitting Nome, and since this storm is so far north, precipitation is falling as snow and blizzard conditions are widespread.

Some news sources are claiming that this storm is a direct result of global warming. This statement is not backed up by scientific evidence, and it misses the whole idea behind global warming. Global warming is occurring, and this is evidenced by trends, such as warmer temperatures in the arctic and receding glaciers throughout the world. You cannot blame a singular weather event on global warming. If storms of these magnitude start pounding the Bering Sea consistently, one could make a connection between the increase of greenhouse gasses in the air and the occurrence of these storms. Right now, though, it is too early to say.

Lastly, I'd like to show you a video from Nome, Alaska.


Where is Jim Foreman when you need him?

Charlie

Tuesday, November 8, 2011

Cut-Off Low


Tuesday, November 8, 2011
12:48 P.M

Cut-off low over the central U.S. - September 27, 2011

In the coming days, we will see a rather interesting weather event take place far out at sea over the Eastern Pacific. Currently, there is a gigantic trough around 150 degrees west over the Pacific, and this trough is so deep that it will eventually get "cut off" from the main jet stream and create a circular ring of upper-level winds in the atmosphere to the south of the main jet stream while having precipitation at the surface. Take a look at the 500mb forecast this morning for 1:00 P.M. 

Valid 01:00 pm PST Tue, 08 Nov 2011 - 9hr Fcst - UW 12z 36km WRF-GFS 500mb absolute vorticity, heights

Now, look what happens 24 hours later.

Valid 01:00 pm PST Wed, 09 Nov 2011 - 33hr Fcst - UW 12z 36km WRF-GFS 500mb absolute vorticity, heights

Look at that cut-off low! You can clearly see how it is cut off from the main jet stream, which is up in Alaska by this point. And it gets even more cut off from the main jet stream 15 hours later (39 hours from now)

Valid 04:00 am PST Thu, 10 Nov 2011 - 48hr Fcst - UW 12z 36km WRF-GFS 500mb absolute vorticity, heights

Also, look at the jet stream winds at the same time at the 300mb level.

Valid 04:00 am PST Thu, 10 Nov 2011 - 48hr Fcst - UW 12z 36km WRF-GFS 300mb isotachs

Now, look at the 1000-500mb thicknesses. You can see the cold air associated with the low, which makes sense because the now cut-off low pressure system has origins from the Northern Pacific.

Valid 04:00 am PST Thu, 10 Nov 2011 - 48hr Fcst - UW 12z 36km WRF-GFS 1000-500 mb thickness, SLP

Finally, the precipitation associated with the low.

Valid 04:00 am PST Thu, 10 Nov 2011 - 48hr Fcst - UW 12z 36km WRF-GFS 3-hour precip, SLP

Remember that post last week about excitement in the extended? It was referring to this general system. Back then, however, the models showed this system as a consolidated, non cut-off low giving possibly flooding rains to the Pacific Northwest. Cut-off lows are interesting to look at, but weather-wise, they generally are pretty weak because they are isolated from the jet stream, which provides the temperature differences extra-tropical storms need to grow.

Excitement in the extended? Models are flip-flopping around, but the general message is that we will become cold. Check out what KOMO said this morning in their forecast discussion.

"Some interesting things are now appearing on the super-long-range computer forecast models.  The models are trying to bring in some extremely cold air the week of Thanksgiving.  It's still way too early to mark it down in pen, but pencil in a continued pattern change as we get into the heart of November."

I am pretty much convinced at this point that we will get into a colder pattern with heavy snow in the mountains, but I am not convinced about a full arctic outbreak over our area yet. Some models have shown it, and others have not. It's exciting to speculate, but we need to be realistic too. Snow is not looking likely in the lowlands this weekend, but the mountains will get a dumping, and that is perfectly exciting enough for me.

Thanks for checking out the blog!
Charlie