4:44 pm
It's looking more and more like a significant windstorm may be in the works. The models are not as bullish about this storm as they were yesterday morning, but they are still showing very strong winds with widespread power outages possible. Charge your devices tonight!
 |
| Water Vapor Image Taken 4 pm, Nov 17 2015. Credit: NWS |
The picture above is a water vapor satellite image of the eastern Pacific and western North America. I love these things because in addition to helping you infer where clouds may be, they show how moist and dry certain areas of the atmosphere are. There are two main features here: a strong low pressure system that just made landfall near Haida Gwaii (previously known as the Queen Charlotte Islands), and that deep plume of moisture rising north from Hawaii and associated with another powerful low pressure system near 170 degrees west.
These are clearly modeled by the latest GFS model below. The shaded colors represent 6-hour precipitation, the solid black lines are sea-level-pressure, and the dotted blue and red lines are thickness contours.
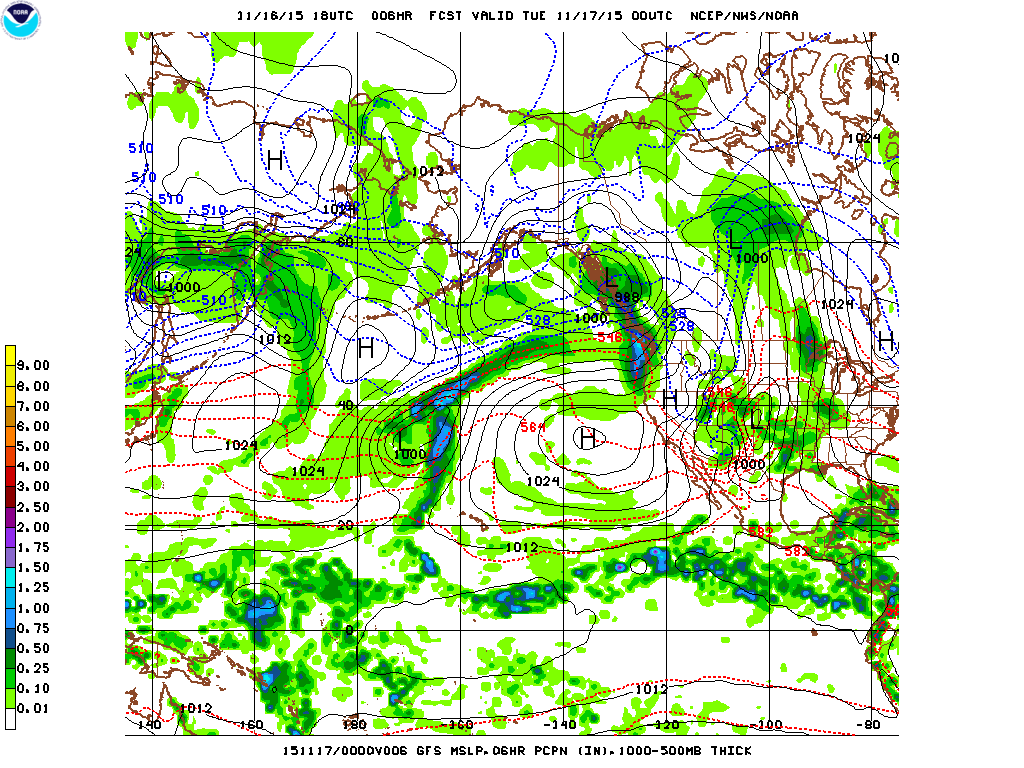 |
| Valid 04:00 pm PST, Mon 16 Nov 2015 - 6hr Fcst Credit: NCEP |
What's most important about the above photograph is not the precipitation, or even the low pressure centers. The most important thing is the large gradient in thicknesses along the stream of moisture extending to the northeast from that low out in the middle of the Pacific. Thicknesses are directly related to temperature via the hypsometric equation, and the steeper the temperature gradient, the steeper the thickness gradient. The steeper the thickness gradient along a certain pressure level (for example, 500 hPa), the steeper the pressure gradient along a certain altitude (for example, 18,000 feet). Therefore, when you have a strong temperature gradient, you have large thickness gradients and a strong pressure gradient force in the upper atmosphere. The stronger the pressure gradient force, the stronger the winds, and as the chart below shows, the winds at the 300 hPa level of the atmosphere will be extremely strong. Here, they are over 150 knots... off the charts. In fact, the latest forecast discussion from the Seattle NWS office says these winds are up to 180 knots, which is truly stunning. Good for storm development, and great for airplanes going eastward across the Pacific. A Boeing 747 cruises at 570 mph, so if the pilot was feeling particularly adventurous and positioned him/herself perfectly in the jet, they could easily break the speed of sound, especially since the speed of sound is about 100 miles per hour slower at 35,000 feet than it is at sea level.
 |
| Valid 04:00 pm PST, Mon 16 Nov 2015 - 6hr Fcst Credit: NCEP |
This jet will aid in the development of a compact, fast-moving, and very wet low pressure system. The system will only be around 995 hPa when it makes landfall on central/southern Vancouver Island, but depth isn't everything.
As I explained earlier, winds in the atmosphere are dependent on the pressure gradient force, or how much the pressure changes over a certain distance. There are two additional characteristics that help determine the strength of winds at the surface: (1) the stability of the atmosphere and (2) the winds aloft. We have these three things, so I'll discuss them in sequential order (with colorful pictures, of course).
Pressure Gradient:
 |
| Valid 01:00 pm PST, Tue 17 Nov 2015 - 33hr Fcst Credit: UW Atmospheric Sciences |
Our greatest storms always have extremely high pressure gradients between Portland and Bellingham. The Portland-Bellingham (also known as PDX-BLI) gradient was a staggering 22.3 hPa back with the Hanukkah Eve Storm of 2006, good for 2nd place all-time (first place was 22.7 hPa back in October 1934). I've never been that good at counting, but the PDX-BLI gradient here looks to be around 16 hPa, which is quite strong. However, the Hanukkah Eve Storm was near 976 hPa when it crashed into the southern tip of Vancouver Island, while this storm (as shown by the 11/16/2015 12z WRF-GFS model above) makes landfall at 994 hPa on Central Vancouver Island. Given that normal sea level pressure is 1013 hPa, why does tomorrow's low generate such an intense pressure gradient?
There are two reasons: first, this low is still developing as it approaches the coast, and when lows are in this phase, they tend to be more compact and have stronger winds and pressure gradients near the center. This also means that regions further to the south - such as the Willamette Valley - will not experience major winds from this storm. Second, there is a pretty substantial high pressure system off the coast of California, which acts to create a bigger pressure change over a certain distance.
 |
| Valid 01:00 pm PST, Tue 17 Nov 2015 - 33hr Fcst Credit: UW Atmospheric Sciences |
Mixing and Stability
I haven't shown the two types of charts below on my blog before, so if you've read this blog post, you have witnessed a truly historical event. Congratulations.
 |
| Credit: UW Atmospheric Sciences |
Most of the charts I post focus on showing what the weather is like at a specific layer of the atmosphere, whether that layer is at the surface, 500 hPa, or 5,000 feet. This chart shows the characteristics of a column of air above a certain station (Seattle) for a given period of time (in this case, 12z 11/16/2015 through 00z 11/19/2015).
Two things are quickly apparent: from 00z 11/17/2015 to 00z 11/18/2015, the air column is pretty humid all the way from the surface to 700 hPa. This means that the atmosphere is well-mixed and that air parcels in the atmosphere are moving vertically throughout the atmosphere. When one of these parcels moves from aloft to the surface, you get a big gust of wind. The large change in humidity near 18/00 represents the location of the cold front, and that is when the strongest winds will be. The tan line near the bottom shows the predicted sea-level-pressure, and you can see that it is lowest right by the cold front.
 |
| Valid 01:00 pm PST, Tue 17 Nov 2015 - 33hr Fcst Credit: UW Atmospheric Sciences |
Here's a 'sounding' showing the vertical profile of the atmosphere at 1 pm tomorrow in Seattle, close to when our strongest winds are predicted to be. The blue line is the dew point, and the red line is the temperature (both in Celsius). They are virtually identical throughout the atmosphere, indicating good mixing, and they roughly follow the red dotted line, which is the moist adiabat and denotes how much a parcel cools with height when it is saturated. If the atmosphere has a lot of vertical movement and is nearly saturated, it will often cool at a rate similar to that of the moist adiabat, and that is what is happening here.
Winds aloft:
As you can see in the sounding above, the winds increase dramatically with height from 25 knots at the surface to 70+ knots at the 900 hPa layer. These winds are shown as the wind 'barbs' on the right side of the chart. Short ticks are 5 knots, long ticks are 10 knots, and triangles are 50 knots. In the sounding at 1 pm, the surface wind barb has one short tick and two long ticks, corresponding to 25 knot sustained winds. As previously stated, due to the atmosphere being well-mixed, those fast winds aloft will be able to make it down to the surface on occasion, resulting in high gusts.
Bottom line:
We will have a variety of factors working in our favor to create high winds throughout Western Washington. I'll be posting details throughout the night on my Facebook Page. Our winds will be strongest around noon or just after, and I think we will experience peak sustained winds of 25-35 mph. Most gusts will be below 60, but some places on the coast may see gusts in the 70s, and a few isolated mountain ridgetops could hit 100 (they might not have weather stations though). There will be flooding on many rivers due to the heavy rain associated with this system, but Seattle will mainly be rainshadowed by the Olympics and won't pick up too much precipitation.
Time to eat dinner! I have a life to attend!
Charlie
No comments:
Post a Comment